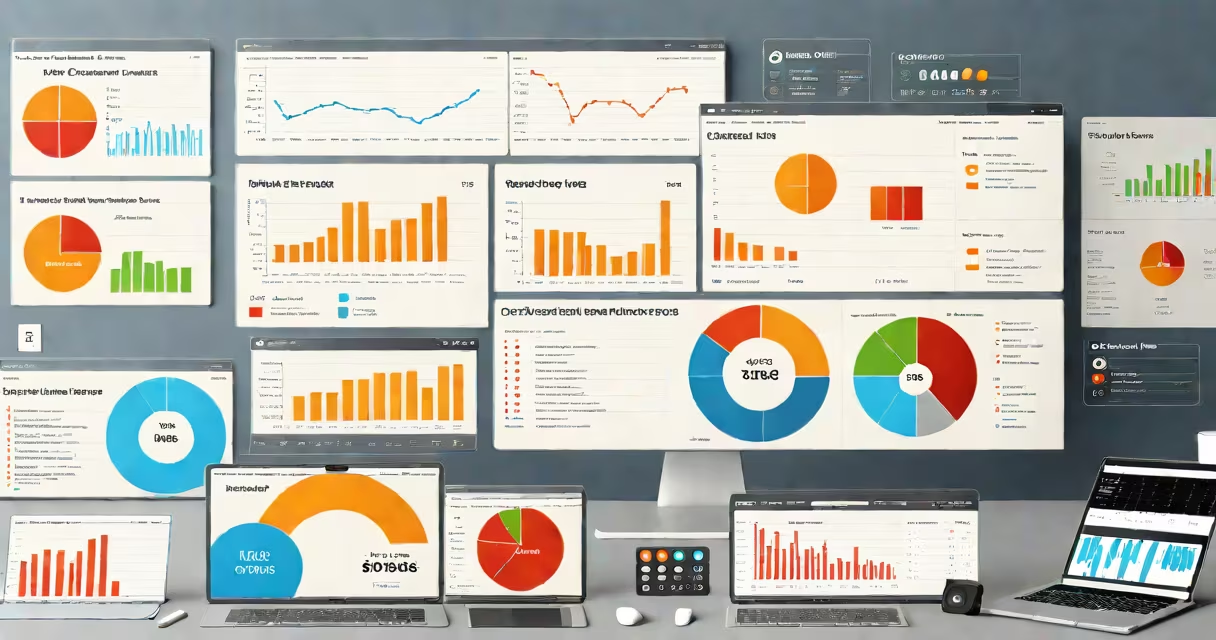
Types of business reports are structured documents that present data, analysis, and insights to support internal decisions, external compliance, or strategic planning. They fall into categories based on purpose, audience, frequency, and content-most commonly financial, operational, and management reports.
Businesses generate reports daily, monthly, or quarterly to track performance, meet regulatory requirements, and guide leadership. These reports convert raw data into actionable information. For example, a retail chain uses weekly sales reports to adjust inventory levels across stores.
Each type serves a distinct function. Financial reports focus on monetary outcomes and compliance. Operational reports track day-to-day activities. Management reports provide summaries for executives to assess strategy and allocate resources. Understanding their differences prevents miscommunication and improves accuracy in reporting.
Reports begin with data collection from systems like accounting software, CRM platforms, or production logs. That data is processed through formulas, filters, and visualizations to show trends, variances, or risks. The final output is delivered via PDF, spreadsheet, dashboard, or presentation.
For instance, a manufacturing company pulls machine uptime data from IoT sensors. A daily operational report flags a 15% drop in efficiency at Plant B. The report includes a chart comparing current output to last month's average and suggests maintenance checks. This enables quick response before downtime escalates.
Reports are only effective if they match the recipient's needs. A CFO requires detailed income statements with variance analysis. A team leader may need a simplified weekly summary showing task completion rates. Misalignment leads to wasted time or poor choices.
The three core types-financial, operational, and management-differ in structure, frequency, and intended use. Each is designed for specific roles within an organization.
| Type | Purpose | Frequency | Example Output |
|---|---|---|---|
| Financial | Track revenue, profit, cash flow, and compliance with GAAP or IFRS standards. | Monthly, quarterly, annually | Income statement, balance sheet, cash flow statement |
| Operational | Monitor daily workflows, production volumes, or service delivery times. | Daily, weekly | Production output log, customer service ticket resolution rate |
| Management | Support strategic decisions using KPIs, forecasts, and trend analysis. | Weekly, monthly, quarterly | Quarterly performance review, market share comparison, budget vs. actuals |
Financial reports are legally binding. Public companies must file audited annual reports under SEC Rule 13a-14. These reports follow strict formats and are reviewed by independent auditors. A failure to comply can result in fines or delisting.
Operational reports often feed into higher-level management reports. A logistics firm generates a daily report tracking shipment delays. Over time, this data reveals patterns-such as delays during winter months due to weather. The insight informs a long-term investment in climate-resistant packaging.
Management reports integrate data from multiple sources. A tech startup's monthly report combines user growth, server load, and support tickets. It shows a 30% increase in sign-ups but a 40% rise in crash reports. Leadership uses this to prioritize engineering resources.
Many assume all business reports are financial. But operational reports-like a warehouse's daily inventory count-do not appear on balance sheets. They serve internal control, not investor disclosure.
Another misconception is that reports are static. In reality, modern tools like Power BI or Tableau enable real-time dashboards. A sales manager can view live conversion rates during a campaign launch, adjusting ads instantly based on performance.
A critical distinction: reports differ from presentations. A report is evidence-based and structured. A presentation may omit data gaps or emphasize positive results. For example, a quarterly earnings call presentation might show revenue growth while downplaying rising customer churn-information that appears in the full financial report.
Consider a SaaS company analyzing its Q2 sales data. The finance team compiles a financial report showing $2.1 million in recurring revenue, a 12% increase from Q1. Net profit margin improved to 28%, up from 24%.
Simultaneously, the operations team produces a report on customer onboarding. It shows that 68% of new users complete setup within 48 hours-a 15-point improvement from last quarter. However, only 41% activate premium features within 30 days.
The management team synthesizes both reports into a strategy document. They recommend increasing onboarding support and offering free trials of premium features. This reduces early churn and boosts lifetime value.
This example shows how types of business reports work together. Financial data confirms profitability. Operational data reveals process bottlenecks. Management reports connect the dots to drive action.
I once built a monthly performance dashboard for a nonprofit using Google Sheets and SQL queries. The tool pulled donation data, event attendance, and volunteer hours. After three months, staff reduced redundant tasks by 35% because they saw which programs had low impact relative to cost. The report didn't just show numbers-it changed behavior.
Leadership effectiveness also hinges on report literacy. The four types of business management-strategic, tactical, operational, and administrative-each rely on different report formats. Strategic leaders use forecasting reports; administrators depend on compliance logs. Matching report type to management level ensures alignment.
Types of business reports are not interchangeable. Using a daily operational report to justify a five-year investment plan introduces error. Each type has a role, a timeline, and a standard of accuracy. When used correctly, they turn data into direction.