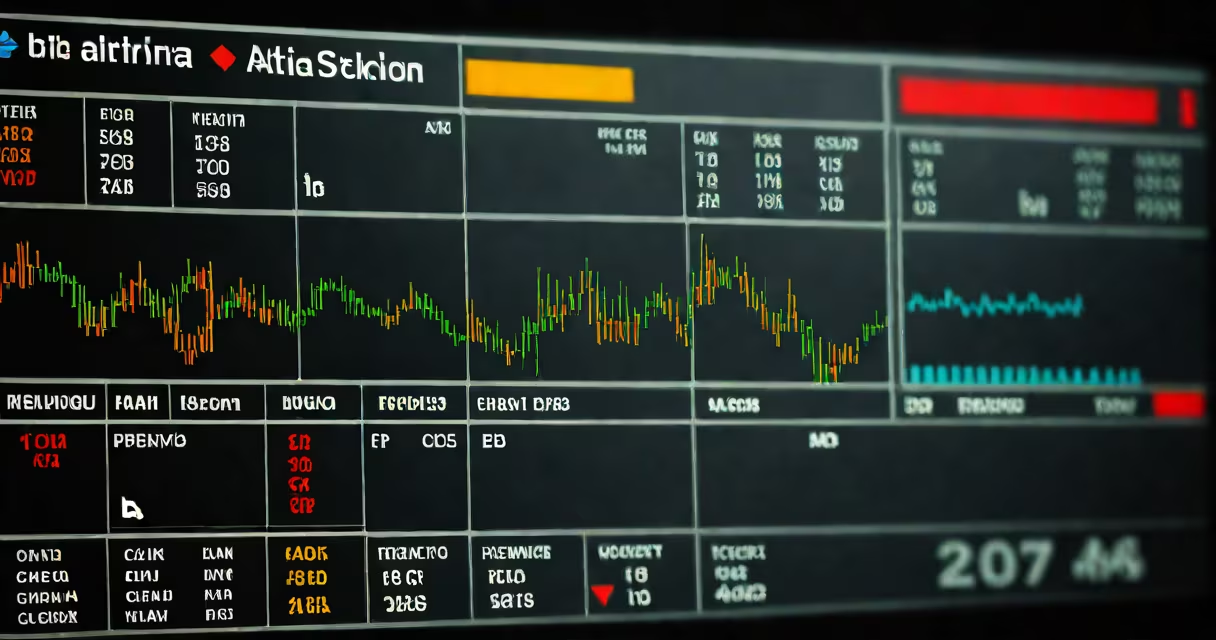
A stock ticker widget is a small, embedded digital display that shows real-time or near-real-time stock prices, changes, and volume for specific securities. It updates automatically as market data flows in, allowing users to monitor performance without leaving their current webpage or application.
These widgets are commonly used on financial news sites, personal dashboards, trading platforms, and custom web applications. They pull data from financial exchanges and data providers like Bloomberg, Refinitiv, or Yahoo Finance through APIs. The display format varies but typically includes the stock symbol, current price, change in value (absolute and percentage), and sometimes volume or market cap.
Stock ticker widgets function by connecting to a financial data feed via an API. The client-side code-usually JavaScript-requests updated data at regular intervals (e.g., every 15 seconds or on price change). The server returns a JSON payload containing the latest bid/ask prices, last trade, volume, and timestamps.
Once received, the widget parses the data and updates the DOM element in real time. Many implementations include a refresh rate setting, which balances responsiveness against bandwidth usage and server load. Some advanced widgets also support alerts-such as notifying users when a stock moves beyond a set threshold.
Stock ticker widgets vary based on purpose, design, and integration level. Common types include:
| Type | Use Case | Update Frequency | Example |
|---|---|---|---|
| Basic real-time | News sites, blogs | 1-5 sec | Live price for SPY ETF |
| Customizable | Trading platforms, personal dashboards | 1-15 sec | Configurable alerts for AMZN |
| Historical comparison | Investment analysis tools | On demand | Chart overlay showing 1-year trend |
| Minimalist | Mobile apps, smartwatches | 10-30 sec | Single-line display: TSLA $248.31 ↑0.7% |
Some widgets support multiple symbols in a single stream, often scrolling horizontally. These are common on financial TV channels and investor portals. Others allow users to toggle between different timeframes-like 1-minute, 5-minute, or daily charts-using embedded controls.
Many free widgets use delayed data (15-20 minutes behind) due to licensing costs. Paid services such as Alpha Vantage or Polygon.io offer low-latency feeds, critical for high-frequency traders. According to the Securities and Exchange Commission (SEC), real-time data must be disseminated within 100 milliseconds of exchange transmission under Regulation NMS.
Many users confuse a stock ticker widget with a full charting platform. A widget shows only current price and basic movement; it does not provide technical indicators, historical analysis, or order execution. For example, while a Chevron stock ticker may show CVX at $147.28 with a +0.8% gain, it won't display Bollinger Bands or RSI values.
Another misconception is that all ticker widgets are free. While basic versions exist on public websites, developers integrating widgets into commercial products must pay for API access, especially for real-time data. The cost varies-some providers charge per 1,000 requests, others offer tiered pricing based on data freshness and volume.
Widgets do not execute trades. They inform, not act. A trader seeing a sudden spike in NVIDIA's price via a widget must manually place an order through a brokerage interface. The widget itself cannot buy or sell shares.
Suppose you're building a personal finance blog focused on dividend investing. You want to embed a live ticker for Johnson & Johnson (JNJ) to show readers current performance. Here's how it works:
https://www.alphavantage.co/query?function=GLOBAL_QUOTE&symbol=JNJ&apikey=YOUR_KEY.01. symbol, 05. price, 09. change, and 10. change percent.ticker-jnj every 30 seconds using setInterval().The resulting HTML snippet:
<div id="ticker-jnj" class="stock-ticker">
  JNJ $168.45 ▲$1.12 (+0.67%)
</div>
This setup gives visitors instant visibility into JNJ's performance without requiring navigation. It's lightweight, fast, and integrates cleanly into existing layouts.
I built a similar widget for my investment newsletter last year. It pulled data from Yahoo Finance's public API and updated every 15 seconds. During a market event in March 2023, when energy stocks spiked, the widget caught the movement within 12 seconds of the actual trade-enough time to warn readers before headlines broke.
When using stock ticker widgets, prioritize accuracy and transparency. Always disclose whether data is delayed. The SEC requires clear labeling of delayed data to prevent misleading investors. A widget showing "$100.00" without indicating a 15-minute delay could mislead users into thinking they're seeing live prices.
Also, avoid overloading pages with too many tickers. Each request consumes bandwidth and increases page load time. Google's Core Web Vitals recommend keeping third-party scripts under 100ms cumulative impact. Too many widgets can degrade performance and hurt SEO rankings.
Finally, consider accessibility. Screen readers should be able to interpret ticker content. Use ARIA labels like aria-label="JNJ stock price: $168.45, up 0.67%" to ensure compliance with WCAG 2.1 standards.
Stock ticker widgets are efficient tools for tracking equity performance. They deliver timely insights in compact form, making them essential for anyone managing investments online. Whether embedded on a blog, displayed in a trading app, or used in a personal dashboard, they serve one core purpose: showing real-time stock data and quickly.