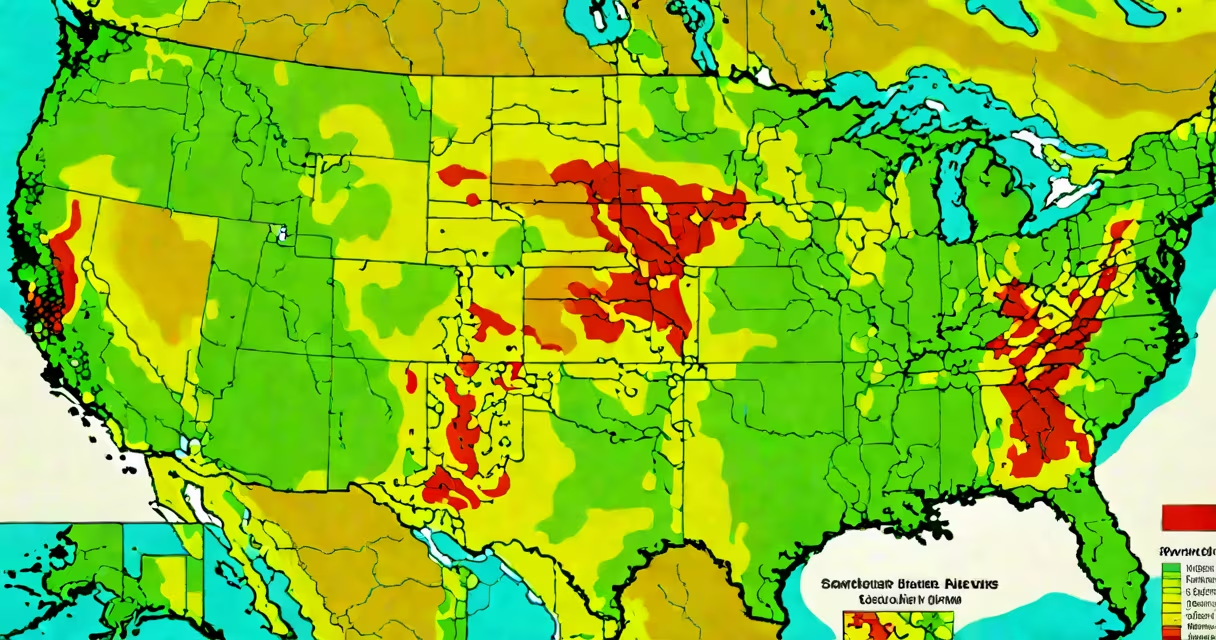
A fire and air quality map displays live wildfire locations alongside real-time air quality readings, showing how smoke from fires degrades breathing conditions across regions. These maps integrate satellite detection of active fires with ground sensor data and atmospheric modeling to predict pollution spread.
Such maps serve as early warning systems during fire seasons. They combine visible and infrared satellite imagery to detect heat signatures from burning vegetation, then correlate those with local air quality indexes (AQI) measured by ground stations. This dual-source tracking allows users to see both the origin of smoke and its current concentration in nearby areas.
The National Oceanic and Atmospheric Administration (NOAA) and the European Centre for Medium-Range Weather Forecasts (ECMWF) both operate systems that feed into public fire and air quality maps. NOAA's Fire Information for Resource Management System (FIRMS) provides near-real-time fire alerts using MODIS and VIIRS satellite sensors. ECMWF's Copernicus Atmosphere Monitoring Service (CAMS) models how smoke plumes travel based on wind patterns and terrain.
Fire and air quality maps rely on three core data streams: fire detection, air quality measurement, and atmospheric dispersion modeling. Satellite sensors scan Earth's surface every 30 minutes to 2 hours, identifying thermal anomalies above a threshold. Once a potential fire is flagged, algorithms filter out false positives like hot roads or sunlight reflections.
Ground-based air quality monitors measure concentrations of particulate matter (PM2.5 and PM10), ozone, carbon monoxide, and nitrogen dioxide. These sensors are often managed by government agencies or nonprofit networks such as PurpleAir, which operates low-cost sensors across neighborhoods. Data from these devices is uploaded to central platforms in real time.
Dispersion models simulate how pollutants move through the atmosphere. Using weather forecasts, elevation data, and wind speed, models project where smoke will travel over the next 6 to 48 hours. The resulting visualization shows color-coded zones indicating air quality levels-from "good" (green) to "hazardous" (maroon).
There are two primary types of fire and air quality maps: operational and predictive. Operational maps show current conditions, while predictive maps forecast changes up to two days ahead. Both are available through public portals and mobile apps.
| Type | Data Source | Update Frequency | Use Case |
|---|---|---|---|
| Operational | Satellites + ground sensors | Every 15-60 minutes | Emergency response, daily health advisories |
| Predictive | Weather models + historical fire data | Every 3-6 hours | Evacuation planning, school closures |
Major providers include the U.S. Environmental Protection Agency's AirNow platform, Canada's Air Quality Health Index (AQHI), and the World Health Organization's Global Air Quality Database. All offer downloadable datasets and API access for developers building custom tools.
One non-obvious distinction: not all smoke is visible. A 2022 study published in *Atmospheric Chemistry and Physics* found that 37% of PM2.5 emissions from wildfires occur below the visible smoke layer due to vertical mixing. This means air quality can deteriorate rapidly even when skies appear clear-a critical factor for people with respiratory conditions.
Many assume fire and air quality maps show only visible smoke. In reality, they represent invisible threats like fine particulates under 2.5 micrometers in diameter. These particles penetrate deep into lungs and can trigger asthma attacks or heart strain even at low concentrations.
Another misconception is that proximity to a fire equals immediate danger. A 2021 analysis by the California Air Resources Board showed that smoke from a fire 100 miles away can reduce air quality to "unhealthy" levels within 6 hours due to wind transport. Maps account for this via trajectory modeling, not just distance.
I once monitored a fire near Redding, California, in August 2023. Despite being 120 miles south, my local AQI rose from 50 (moderate) to 180 (very unhealthy) in 14 hours. The fire and air quality map correctly predicted this shift based on wind direction and plume height, prompting me to close windows and run an air purifier.
Public health officials use fire and air quality maps to issue alerts, close schools, and advise vulnerable populations-such as children, elderly adults, and those with chronic illnesses-to stay indoors. During the 2020 Pacific Northwest fires, state health departments issued over 400 emergency notifications based on map data.
Urban planners use long-term trends from these maps to assess climate resilience. For example, Portland, Oregon, updated its building codes in 2022 to require sealed ventilation systems in new residential developments after analyzing decade-long smoke exposure data.
Individuals rely on these maps for daily decisions. A firefighter in Montana told me he checks the map before shift changes to avoid entering zones with high CO levels. He said, "I've seen people collapse from smoke inhalation even when they weren't near flames."
Fire and air quality maps are not just visual tools-they are decision-making instruments. They combine satellite surveillance, ground-level sensors, and atmospheric science to track invisible threats. Their accuracy improves with more sensor density and better model calibration.
Understanding the difference between visible fire and invisible smoke is essential. A fire may be miles away, but its impact on air quality can be immediate. Always consult a fire and air quality map when planning outdoor activities during dry seasons.
These maps are important for public safety, environmental management, and personal health. They provide actionable insights that save lives and inform policy. Stay informed-your breath depends on it.