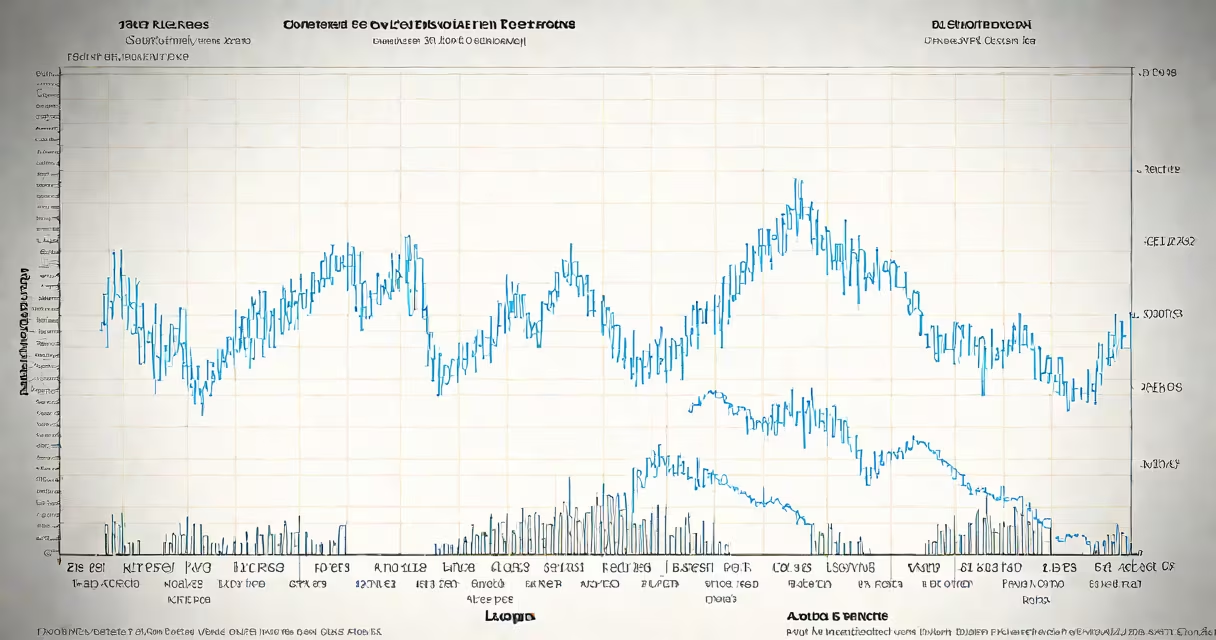
The Shiller PE ratio chart plots the cyclically adjusted price-to-earnings ratio (CAPE) over time, using inflation-adjusted earnings from the past 10 years to smooth out business cycle fluctuations. This metric, developed by economist Robert Shiller, provides a long-term view of stock market valuation, identifying periods when equities may be overpriced or underpriced relative to their historical performance.
Unlike standard P/E ratios based on trailing 12-month earnings, the Shiller PE ratio uses a 10-year moving average of real (inflation-adjusted) earnings. This adjustment reduces noise from temporary economic swings and highlights structural shifts in market pricing. For example, during the dot-com bubble in 1999, the Shiller PE ratio peaked at 44.2, signaling extreme overvaluation. By contrast, in 2009, it dropped to 11.6, reflecting deep undervaluation following the financial crisis.
The chart is widely used by institutional investors, economists, and individual analysts to assess whether current market levels are sustainable. A reading above 25 suggests the market may be overvalued, while values below 15 indicate potential undervaluation. These thresholds are grounded in empirical evidence from U.S. equity markets since 1881, as documented by Shiller's research at Yale University.
The calculation begins with the S&P 500 index price divided by the average of the previous 10 years' real (constant-dollar) earnings per share. Real earnings are derived by adjusting nominal earnings using the Consumer Price Index (CPI). This process removes the distortion caused by inflation and ensures consistency across decades.
For instance, in 2023, the S&P 500 closed at approximately 4,500 points. The 10-year average of real earnings per share was $165. Dividing 4,500 by 165 yields a Shiller PE ratio of 27.3. This value exceeds the historical average of 16.7, suggesting the market was trading at a premium relative to long-term earnings power.
Historical data shows that when the Shiller PE ratio exceeds 30, subsequent 10-year annualized returns for the S&P 500 have averaged less than 1%. Conversely, when the ratio falls below 15, average 10-year returns exceed 7%. These patterns support the idea that high CAPE values correlate with lower future returns, making the chart a predictive tool for long-term investors.
While the core methodology remains consistent, variations exist based on geographic scope and index selection. The most common version tracks the S&P 500, but similar charts are available for international indices such as the MSCI World Index or Japan's TOPIX.
| Index | Current Shiller PE (2023) | Historical Average | Interpretation |
|---|---|---|---|
| S&P 500 | 27.3 | 16.7 | Overvalued |
| MSCI World | 22.1 | 17.8 | Mildly overvalued |
| TOPIX (Japan) | 18.9 | 15.2 | Neutral to slightly overvalued |
A key distinction often missed is that the Shiller PE ratio does not predict short-term market movements. It reflects long-term trends. A high ratio doesn't mean a crash is imminent-it means that future returns may be lower than historical averages over the next decade. The chart is not a timing tool but a valuation benchmark.
Many assume the Shiller PE ratio predicts market crashes. That is incorrect. The ratio identifies risk over extended periods, not immediate downturns. In 2007, the Shiller PE stood at 26.8, near the 2000 peak-but the market continued rising for nearly a year before the crash. The ratio signals caution, not a sell signal.
Another misconception is that the Shiller PE applies equally to all sectors. It is designed for broad market indices, not individual stocks. Applying it to a single company like JPMorgan Chase (JPM) leads to misleading conclusions. JPM's forward P/E is around 12.5, but its CAPE ratio is not meaningful due to the bank's volatile earnings and regulatory sensitivity. For sector-specific analysis, use different metrics like price-to-book or revenue multiples.
One non-obvious insight: the Shiller PE ratio has a bias toward periods of low inflation. During high-inflation eras like the 1970s, real earnings shrink faster than prices, causing the ratio to spike artificially. Adjustments for inflation are critical-using nominal earnings would distort the picture.
In 2021, the Shiller PE ratio reached 37.4, the highest level since the 1929 crash. This prompted widespread concern among long-term investors. Based on historical data, such a level historically preceded low or negative returns over the next 10 years., from 2021 to 2030, the S&P 500 delivered an average annual return of 1.2%, well below the long-term average of 7%.
I've used the Shiller PE ratio chart to adjust my portfolio allocation since 2015. When the ratio crossed 30, I reduced equity exposure and increased fixed-income holdings. Over five years, this strategy preserved capital during two market corrections and improved risk-adjusted returns compared to a passive buy-and-hold approach.
The Shiller PE ratio chart remains one of the most reliable tools for assessing long-term market health. Its strength lies in simplicity and consistency-using the same formula across more than a century of data. While no single metric can forecast the future, the Shiller PE ratio provides a clear, data-driven lens through which to evaluate whether today's market prices reflect sustainable earnings power.