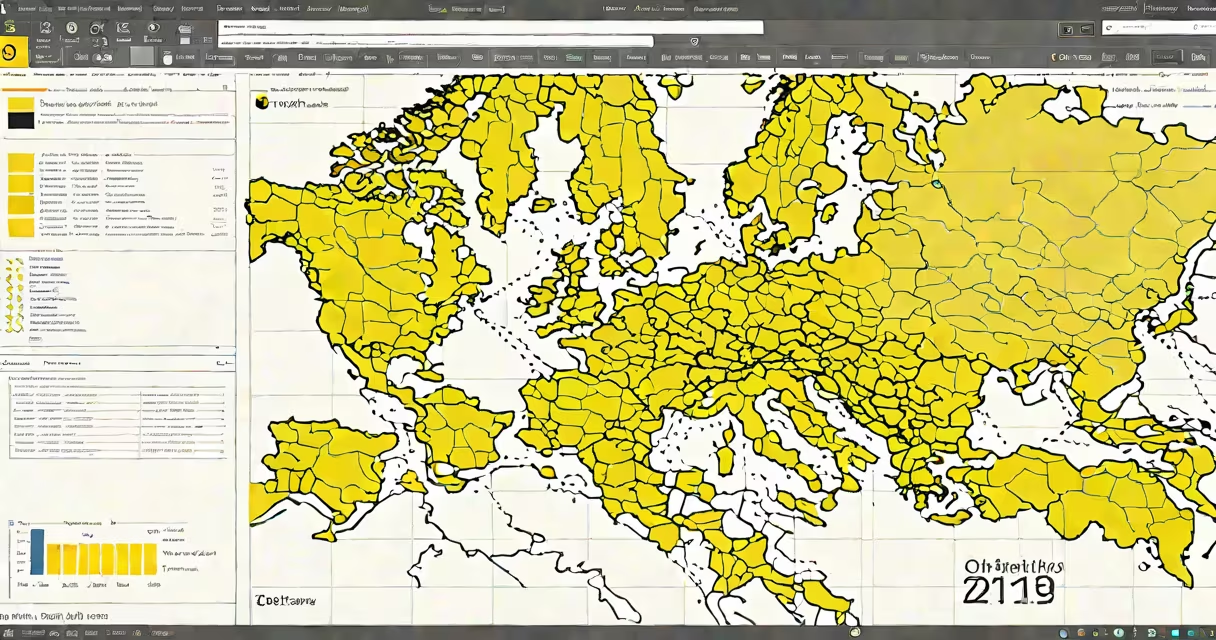
Power BI Desktop Free is a standalone application from Microsoft that enables users to connect to data sources, change data, build visualizations, and create interactive reports-all at no cost. It's designed for individuals and small teams who need advanced analytics without licensing fees.
Unlike cloud-only versions of Power BI, Power BI Desktop Free runs locally on Windows and stores data and reports on your machine. You can publish reports to the Power BI service for sharing, but the free version doesn't include live collaboration features or enterprise-grade security controls.
Microsoft offers Power BI Desktop Free under the Microsoft Product Terms, which allow personal and commercial use without charge. It supports importing data from Excel, CSV, databases, web services, and APIs. Once data is loaded, users apply transformations using Power Query Editor and build visuals with DAX formulas.
Power BI Desktop Free operates in three core stages: data ingestion, transformation, and visualization. First, you import data from supported sources-such as SQL Server, Azure SQL, or a local Excel file-using the "Get Data" button. The tool automatically detects file formats and suggests connection methods.
Next, the Power Query Editor allows filtering, merging, pivoting, and cleaning data. For example, if you have a sales CSV with inconsistent date formats, you can standardize them using the "Change Type" function and remove blank rows with a single click. These steps happen in a step-by-step preview window, so changes are visible before applying.
After preparation, you switch to the "Report" view. Here, you drag fields onto a canvas to generate charts, tables, and maps. You can customize colors, add slicers, and set drill-down behaviors. A report saved as a.pbix file can be opened later on any Windows PC with Power BI Desktop installed.
Power BI Desktop Free is built on the same engine as the paid Power BI Pro and Premium offerings. It uses the Microsoft Analysis Services (SSAS) tabular model for data storage and the DAX (Data Analysis Expressions) language for calculations. This means reports created in the free version can scale to enterprise environments with minimal refactoring.
The tool includes several components:
There is no version differentiation between "free" and "paid" in the core app. All features available in Power BI Desktop Free are also present in the licensed versions-except for publishing limits and cloud integration. The difference lies in access to the Power BI service, where only paid licenses allow scheduled refreshes, row-level security, and shared workspaces.
Individual analysts, students, and small businesses use Power BI Desktop Free to analyze sales figures, track website traffic, monitor inventory levels, or forecast revenue. A retail manager might pull daily transaction data from a database, clean out duplicates, and build a dashboard showing top-selling products by region.
For example, a nonprofit organization tracking donations received monthly across five states used Power BI Desktop Free to combine Google Sheets data with a local SQLite database. After removing incomplete entries and aggregating totals by state, they created a stacked bar chart showing donation trends over six months. The report was then published to a public Power BI workspace for board review.
It's also widely used in education. According to Microsoft's official documentation, over 1 million students enrolled in Power BI training through Microsoft Learn in 2023, many using the free desktop version for hands-on practice. The tool's low barrier to entry makes it ideal for learning data modeling and DAX logic.
Many assume Power BI Desktop Free cannot handle large datasets. This is incorrect. While performance degrades with very large files (over 10GB), the tool can process up to 10 million rows efficiently when optimized. Using columnar storage, incremental refresh, and proper indexing reduces load times.
A common mistake is confusing Power BI Desktop Free with Power BI Service. The desktop app is for building reports. The service is for sharing, scheduling, and collaborating. You can't run a report from the desktop app in a browser unless it's published to the service. Publishing requires a Power BI account-but the account itself is free.
Another misconception is that Power BI Desktop Free lacks advanced analytics. It supports time intelligence functions like YOY growth, moving averages, and period-over-period comparisons using DAX. For instance, calculating "sales growth compared to last year" requires just one DAX measure:
Year Over Year Growth =
DIVIDE(
    [Total Sales],
    CALCULATE([Total Sales], SAMEPERIODLASTYEAR('Date'[Date]))
) - 1
This calculation works identically in both free and paid versions.
| Feature | Power BI Desktop Free | Power BI Pro (Paid) |
|---|---|---|
| Local data processing | Yes | Yes |
| Publish to Power BI service | Yes (limited) | Yes (full access) |
| Scheduled data refresh | No | Yes (up to 8 times/day) |
| Row-level security | No | Yes |
| Collaborative editing | No | Yes |
Power BI Desktop Free is not a substitute for enterprise deployment. But for individual use, prototyping, or internal reporting, it delivers professional-grade capabilities without cost.
I built a sample budget tracker for a freelance graphic designer using Power BI Desktop Free. She imported her QuickBooks export, cleaned the transaction descriptions, grouped expenses by category, and added a trend line showing spending versus income. The final report included a filter for month and a summary card showing net balance. It took less than two hours to complete and required no coding.
For those looking to extend functionality, Power BI Desktop Free integrates with external tools. You can use ArcGIS for Power BI to overlay spatial data on maps, or connect to Azure Synapse Analytics for larger-scale processing. These extensions are available through the marketplace within the app.
Power BI Desktop Free remains a useful choice for anyone needing to turn raw data into clear insights. With real-world applications ranging from finance to nonprofits, it's a practical solution for learning and deploying analytics at scale.