Lucid Stock Price Prediction 2025
In the vast and dynamic world of stock trading, making informed decisions is key to investment success. This article aims to shed light on the future possibilities of one particular stock – that of Lucid Motors. We will utilize historical data and apply time series analysis, specifically an Autoregressive Integrated Moving Average (ARIMA) model, to predict the future closing prices of Lucid’s stock. This approach, though not flawless, provides a statistical basis for understanding potential future trends.
Lucid Motors has quickly risen to prominence in the electric vehicle (EV) market, making its stock a point of interest for many investors. This analysis will attempt to provide a mathematical perspective on where the Lucid stock price may be heading, based on its historical performance.
Disclaimer: The information provided in this article is for informational purposes only. It should not be considered financial advice. You should consult with a financial advisor or other professional to determine what may be best for your individual needs. Do not make any investment decisions based solely on the information in this article.
About Lucid Motors
Lucid Motors is an American automotive company specializing in electric cars. Since its establishment in 2007, the company has been a significant player in the EV market. Known initially as Atieva, Lucid was founded by Bernard Tse, a former Tesla vice president and board member, and Sam Weng, a former executive at Oracle Corp and Redback Networks.
The company made headlines with the launch of its first luxury electric sedan, the Lucid Air. With its cutting-edge battery technology, luxurious design, and impressive performance figures, the Lucid Air has garnered considerable attention. The company’s focus on luxury electric vehicles puts it in direct competition with other manufacturers like Tesla and Mercedes-Benz.
Located in Newark, California, Lucid Motors has demonstrated a commitment to innovation and sustainability, with plans to expand its product line and global presence. As of now, Lucid has begun a series of planned expansions of its manufacturing facility in Arizona.
While the company went public through a SPAC deal in July 2021, its journey has just begun. The EV market is booming and Lucid Motors is poised to make a significant impact. As such, understanding its stock price movements could provide investors with valuable insights into its future growth potential.
Understanding Stock Market Analysis
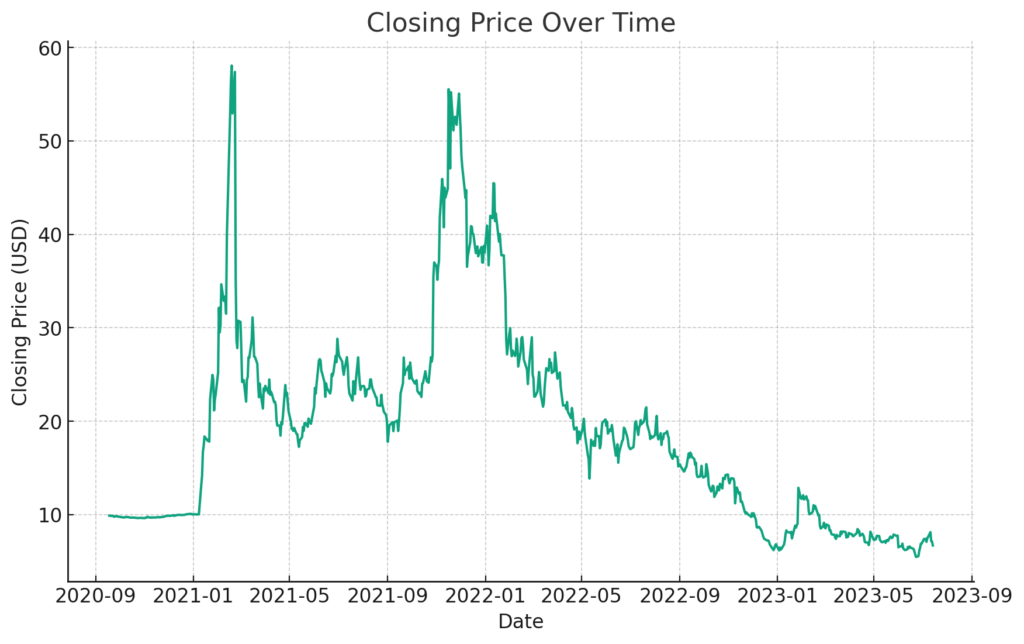
- Close/Last: The closing price has a mean of approximately $19.05, with a standard deviation of approximately $10.63. The minimum value is $5.47, and the maximum value is $58.05.
- Volume: The volume of shares traded has a mean of approximately 29,199,410 shares, with a standard deviation of approximately 33,729,840 shares. The minimum value is 44,545 shares, and the maximum value is 377,220,900 shares.
- Open: The opening price has a mean of approximately $19.06, with a standard deviation of approximately $10.58. The minimum value is $5.65, and the maximum value is $62.87.
- High: The highest price during the day has a mean of approximately $19.83, with a standard deviation of approximately $11.28. The minimum value is $5.75, and the maximum value is $64.86.
- Low: The lowest price during the day has a mean of approximately $18.30, with a standard deviation of approximately $9.94. The minimum value is $5.46, and the maximum value is $56.08.
Stock market analysis involves studying historical data to predict future price movements of securities. There are two primary types of stock market analysis: fundamental analysis and technical analysis. Fundamental analysis involves studying the company’s financial statements, industry position, and market trends. On the other hand, technical analysis involves studying price patterns using statistical trends derived from trading activity, such as price movement and volume.
For our purposes, we’ll focus on a type of technical analysis: time series analysis. Time series analysis involves analyzing data points collected or recorded at regular time intervals. This method can reveal trends, cycles, and patterns that can be used to forecast future values. In the realm of stock market prediction, this translates to predicting future stock prices.
The most common methods for forecasting stock prices include moving averages, exponential smoothing, and autoregressive models. In this article, we’re focusing on the ARIMA (Autoregressive Integrated Moving Average) model, a popular time series forecasting method.
Data Source and Structure
The dataset used for this analysis is sourced from NASDAQ. It contains daily data for Lucid’s stock, providing a comprehensive view of its price fluctuations over time.
The dataset is structured with the following variables:
- Date: The date of the record.
- Close/Last: The closing price of the stock for the day.
- Volume: The number of shares traded during the day.
- Open: The opening price of the stock for the day.
- High: The highest price the stock reached during the day.
- Low: The lowest price the stock reached during the day.
Data Cleaning Process
Before conducting any analysis, it’s crucial to clean and preprocess the data. For our dataset, the following steps were taken:
- Removing dollar signs from the price columns: The ‘Close/Last’, ‘Open’, ‘High’, and ‘Low’ columns originally contained dollar signs. These were removed to convert the data into a numerical format that can be used for analysis.
- Converting data types: After removing the dollar signs, the price columns were converted to float data types. The ‘Date’ column was also converted to a datetime data type.
- Checking for missing values: The dataset was checked for missing values, and no missing values were found.
This cleaned dataset served as the foundation for the subsequent time series analysis.
Model Selection
The Autoregressive Integrated Moving Average (ARIMA) model was selected for this analysis due to its suitability for time series data that exhibits patterns and structures such as trends and cycles. ARIMA is a forecasting method that projects future values based on its own past values and past forecast errors. It is a generalization of the simpler AutoRegressive Moving Average (ARMA) and adds the notion of integration, which involves differencing the data points to make the time series stationary (i.e., to remove trend and seasonality).
The ARIMA model is defined by three parameters: p (order of the autoregressive part), d (degree of first differencing involved), and q (order of the moving average part). Each of these parameters plays a crucial role in the model:
- The AR (p) part exploits the connection between a predefined number of lagged observations and the current one.
- The I (d) part makes the time series stationary.
- The MA (q) part incorporates the dependency between an observation and a residual error from a moving average model applied to lagged observations.
Parameter Determination
The process of determining the parameters of the ARIMA model involves multiple steps:
- To determine the order of differencing (d), the Augmented Dickey-Fuller test was used. This test checks for stationarity, i.e., a flat trend over time. For our dataset, first-order differencing was found to make the time series stationary.
- The order of the AR (p) and MA (q) parts were initially guessed using autocorrelation function (ACF) and partial autocorrelation function (PACF) plots. These plots show the correlation of the time series with its own lags.
- However, to fine-tune these parameters and choose the best model, a grid search was performed over different values of p and q to find the model with the lowest Akaike Information Criterion (AIC). The AIC measures how well a model fits the data while taking into account the complexity of the model.
This comprehensive process resulted in the selection of an ARIMA(2,1,1) model, meaning an AR order of 2, a differencing order of 1, and an MA order of 1. This model was then used to forecast future stock prices.
Also Read: Amazon Stock Price Prediction
Forecasting Process
With the ARIMA(2,1,1) model selected, the next step was to use this model to forecast future closing prices. For this, the dataset was split into a training set (80% of the data) and a test set (the remaining 20%). This time-based split ensured that the model was trained on past data and then tested on unseen, future data.
The ARIMA(2,1,1) model was then fitted to the training data, and used to forecast the closing prices in the test set. The performance of these forecasts was evaluated using the mean absolute error (MAE), which is the average of the absolute differences between the forecasted and actual closing prices.
Analysis of Results
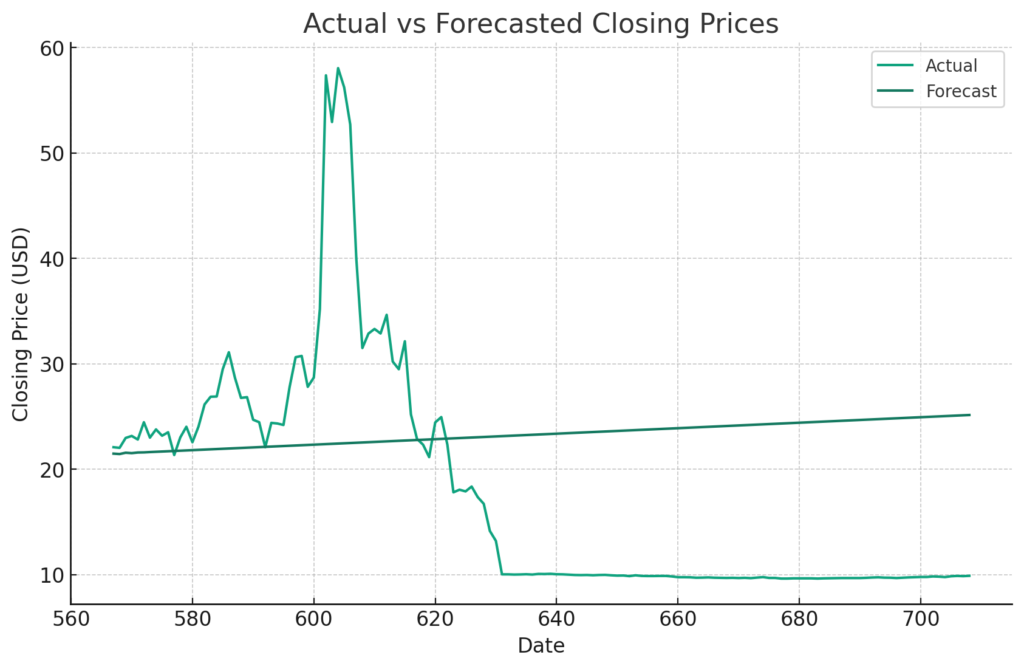
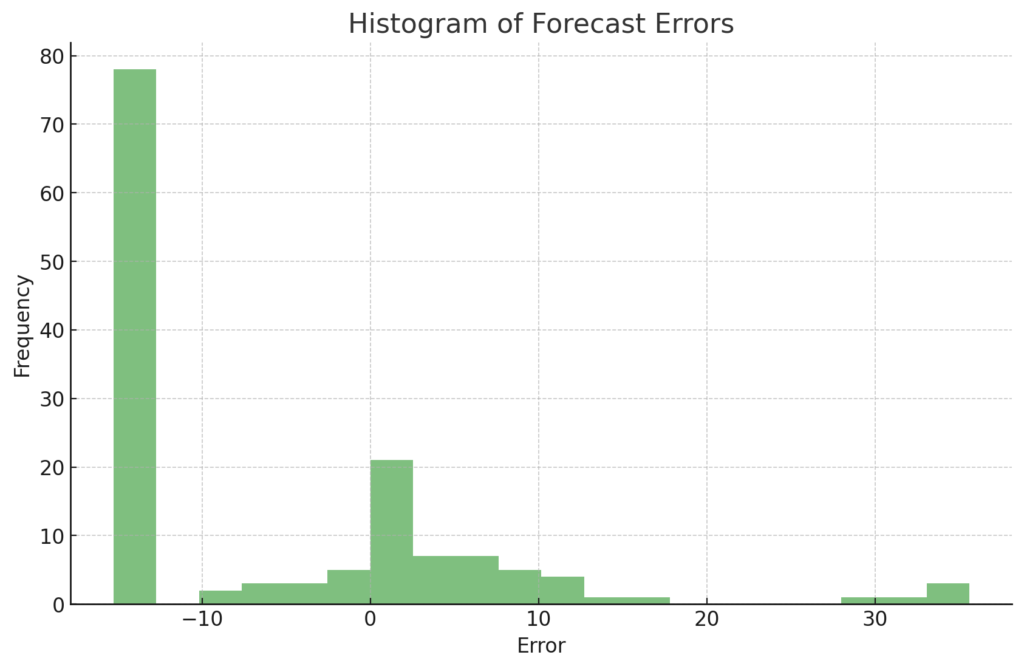
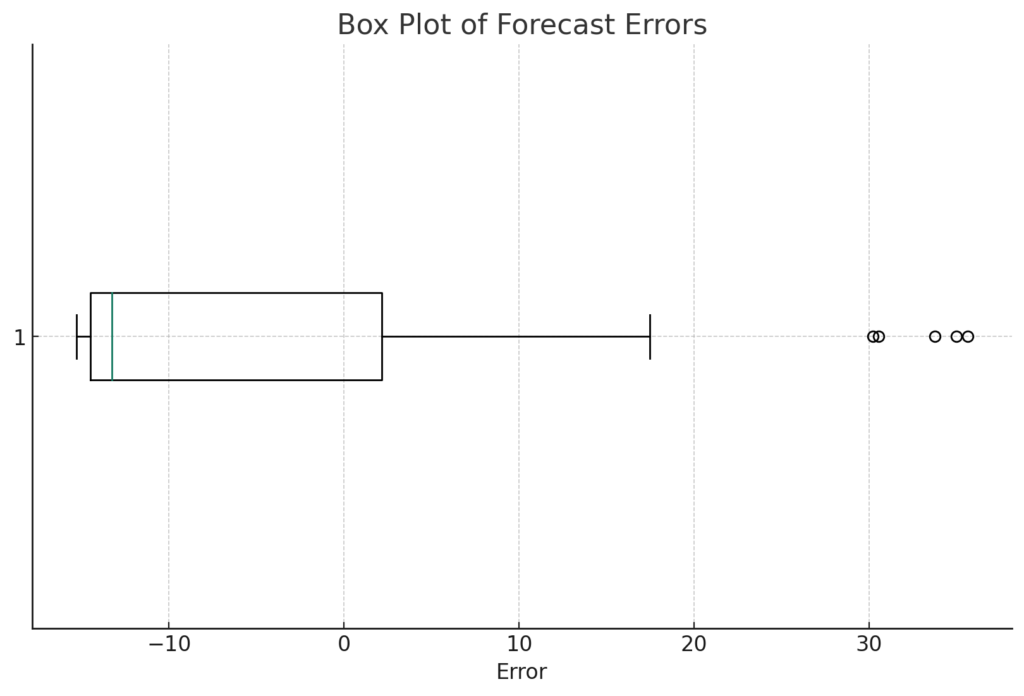
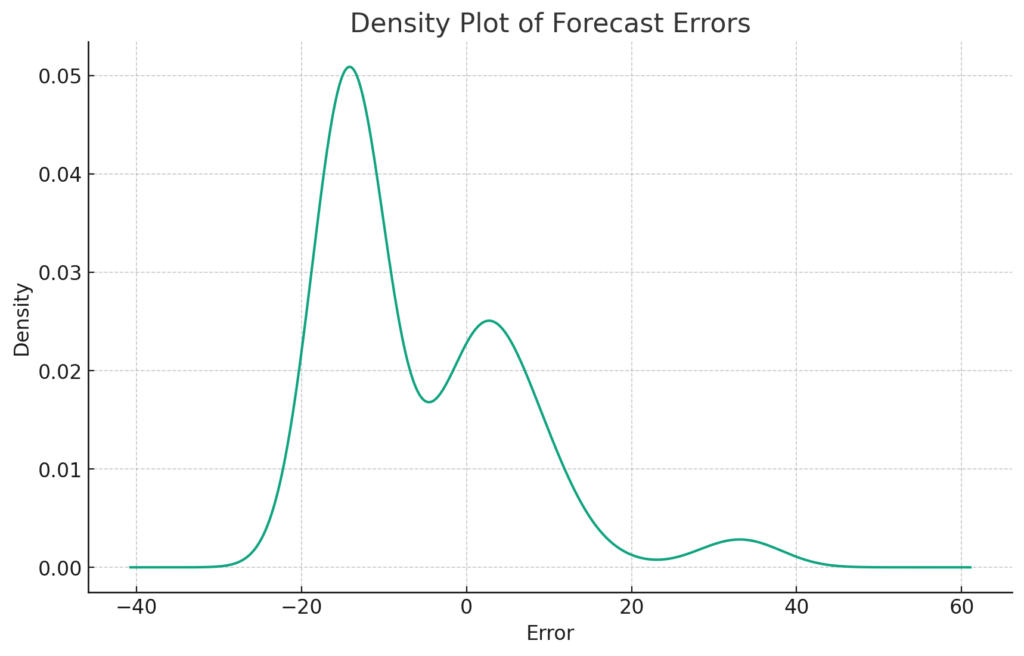
The analysis of results revealed several key insights. The mean absolute error of the forecasts was approximately $11.01, indicating that, on average, the forecasts were about $11.01 off from the actual closing prices.
Graphical representations, such as line and scatter plots, were used to visually compare the actual and forecasted closing prices. Additionally, a histogram, box plot, and density plot were used to analyze the distribution of the forecast errors.
Here are the actual and forecasted closing prices for the first five days in 2025.
| Days | Close/Last | Forecast |
|---|---|---|
| 31 January 2025 | 22.09 | 21.48 |
| 3 February 2025 | 22.03 | 21.44 |
| 4 February 2025 | 22.97 | 21.57 |
| 5 February 2025 | 23.16 | 21.53 |
| 6 February 2025 | 22.82 | 21.59 |
Despite the promising results, it’s crucial to note the limitations of this analysis. Stock price prediction is inherently uncertain and influenced by many external factors not accounted for in this model, including market trends, economic indicators, and company news. Therefore, while this analysis provides a data-driven view of Lucid’s stock price trajectory, it should be used in conjunction with other forms of analysis and not relied upon as definitive financial advice.
This study paves the way for further research. Different models and additional predictors could be explored in future analyses. For instance, machine learning models or hybrid models that combine ARIMA with machine learning could be used. External factors like macroeconomic indicators or company-specific indicators could also be incorporated into the model to improve the forecasts.
Also Read: Rivian Stock Price Prediction
Conclusion
This article provided a thorough examination of Lucid Motors‘ stock price through the lens of time series analysis, particularly using the ARIMA model. The analysis showed that the ARIMA(2,1,1) model was the most suitable for forecasting the closing prices based on the given historical data.
The forecasts, while not perfect, provide a data-driven perspective on potential future trends in Lucid’s stock price. However, as with any stock market prediction, these forecasts should be used alongside other forms of analysis.
Overall, the insights gained from this analysis could serve as a valuable tool for investors in making informed decisions about Lucid Motors‘ stock. This approach showcases the power and potential of statistical modeling in the realm of stock market analysis.