Rivian Stock Price Prediction 2024

Rivian is an American automaker and automotive technology company founded in 2009. The company is recognized for producing vehicles with a focus on electric powertrains and autonomous technology. Rivian grabbed global attention with its innovative electric models, the R1T pickup, and the R1S SUV. With an aim to provide sustainable transportation, Rivian has positioned itself as a major player in the electric vehicle (EV) market and has been contributing significantly towards a zero-emissions future.
Overview of Rivian’s Stock
Rivian went public in November 2021. The company’s initial public offering (IPO) was one of the biggest of the year, and the stock started trading under the ticker symbol “RIVN” on the NASDAQ exchange.
Since its IPO, Rivian’s stock has experienced significant fluctuations. Initially, the stock price soared, driven by investor enthusiasm for EV companies. However, it has also faced periods of decline due to various factors, including the overall volatility of the EV market, mixed earnings reports, and changing investor sentiment toward growth stocks.
A few noteworthy events have particularly affected the stock price:
- The announcement of a major investment from Amazon, which plans to purchase 100,000 electric vans from Rivian.
- The global chip shortage, which has impacted production capabilities for many automakers, including Rivian.
- Periodic updates on the company’s production numbers and delivery targets.
Despite these fluctuations, Rivian has remained a key player in the EV market, and its stock continues to draw significant interest from investors.
In the next part of this article, we will delve deeper into the data used for predicting Rivian’s stock price and the methodologies employed.
Description of the Dataset
The data used for predicting the Rivian stock price was sourced from Nasdaq. The dataset offers a comprehensive view of the historical performance of Rivian’s stock. It contains the following fields:
- Date: The date of the trading day.
- Close/Last: The closing price of the stock for the day.
- Volume: The number of shares that changed hands during the day.
- Open: The price of the stock at the beginning of the trading day.
- High: The highest price of the stock during the trading day.
- Low: The lowest price of the stock during the trading day.
This data provides a basis for understanding the stock’s past performance, which is crucial in making future price predictions.
Data Preprocessing
Before proceeding with the prediction, the data underwent several preprocessing steps to ensure its quality and usability:
- Cleaning the data: The dollar signs in the price columns (Close/Last, Open, High, Low) were removed, and the values were converted to the correct data type (float) for numerical analysis.
- Checking for missing values: The dataset was checked for any missing values that could affect the reliability of the prediction.
These preprocessing steps are essential to prepare the data for further analysis and to ensure that the predictions are based on accurate and consistent information. In the next part of the article, we will discuss the methodology used for stock price prediction.
Overview of Time Series Forecasting
Time series forecasting is a technique to predict future events based on known past data points. It involves using a model to identify patterns, trends, and relationships in the historical data, and extrapolating them into the future. This technique is commonly used in various domains including finance, economics, and business, for forecasting stock prices, sales, and economic indicators, among others.
Predicting stock prices, however, is particularly challenging due to several reasons:
- Stock prices are highly volatile and can be influenced by a multitude of unpredictable factors such as market sentiment, economic indicators, geopolitical events, and company-specific news.
- They often display non-linear trends and abrupt shifts that are difficult to capture with conventional time series models.
- Stock prices are also subject to various irregularities such as sudden spikes and crashes, making the prediction even more complex.
Explanation of the Exponential Smoothing Model
For this analysis, the Exponential Smoothing model was chosen to forecast Rivian’s stock price. Exponential smoothing is a time series forecasting method for univariate data. It works by giving more weight to recent observations and progressively less weight to older observations. This makes it particularly suitable for data with trends.
The model was chosen for its simplicity and effectiveness in capturing trends in the data. It’s a versatile method that can be used to forecast data with various types of trends and seasonality.
However, it’s important to be aware of the limitations of the Exponential Smoothing model:
- It assumes that future patterns will resemble past patterns, which may not hold true for stock prices due to their unpredictable nature.
- It doesn’t account for factors outside the dataset that can significantly affect stock prices, such as economic events, company news, and market sentiment.
- Its accuracy decreases as the forecast horizon (the distance in time into the future of the forecast) increases.
In the next part of the article, we will present the results of the stock price prediction and provide visual representations of the forecasts.
Presentation of the Forecasted Prices
The Exponential Smoothing model was used to forecast the Rivian stock price for the next 365 days. The table below provides an excerpt of the forecasted prices:
Here are the last 5 days of the 365-day forecast using the Exponential Smoothing model:
| Day (from now) | Predicted Closing Price (USD) |
|---|---|
| 364 | 208.90 |
| 365 | 209.14 |
| 366 | 209.38 |
| 367 | 209.62 |
| 368 | 209.86 |
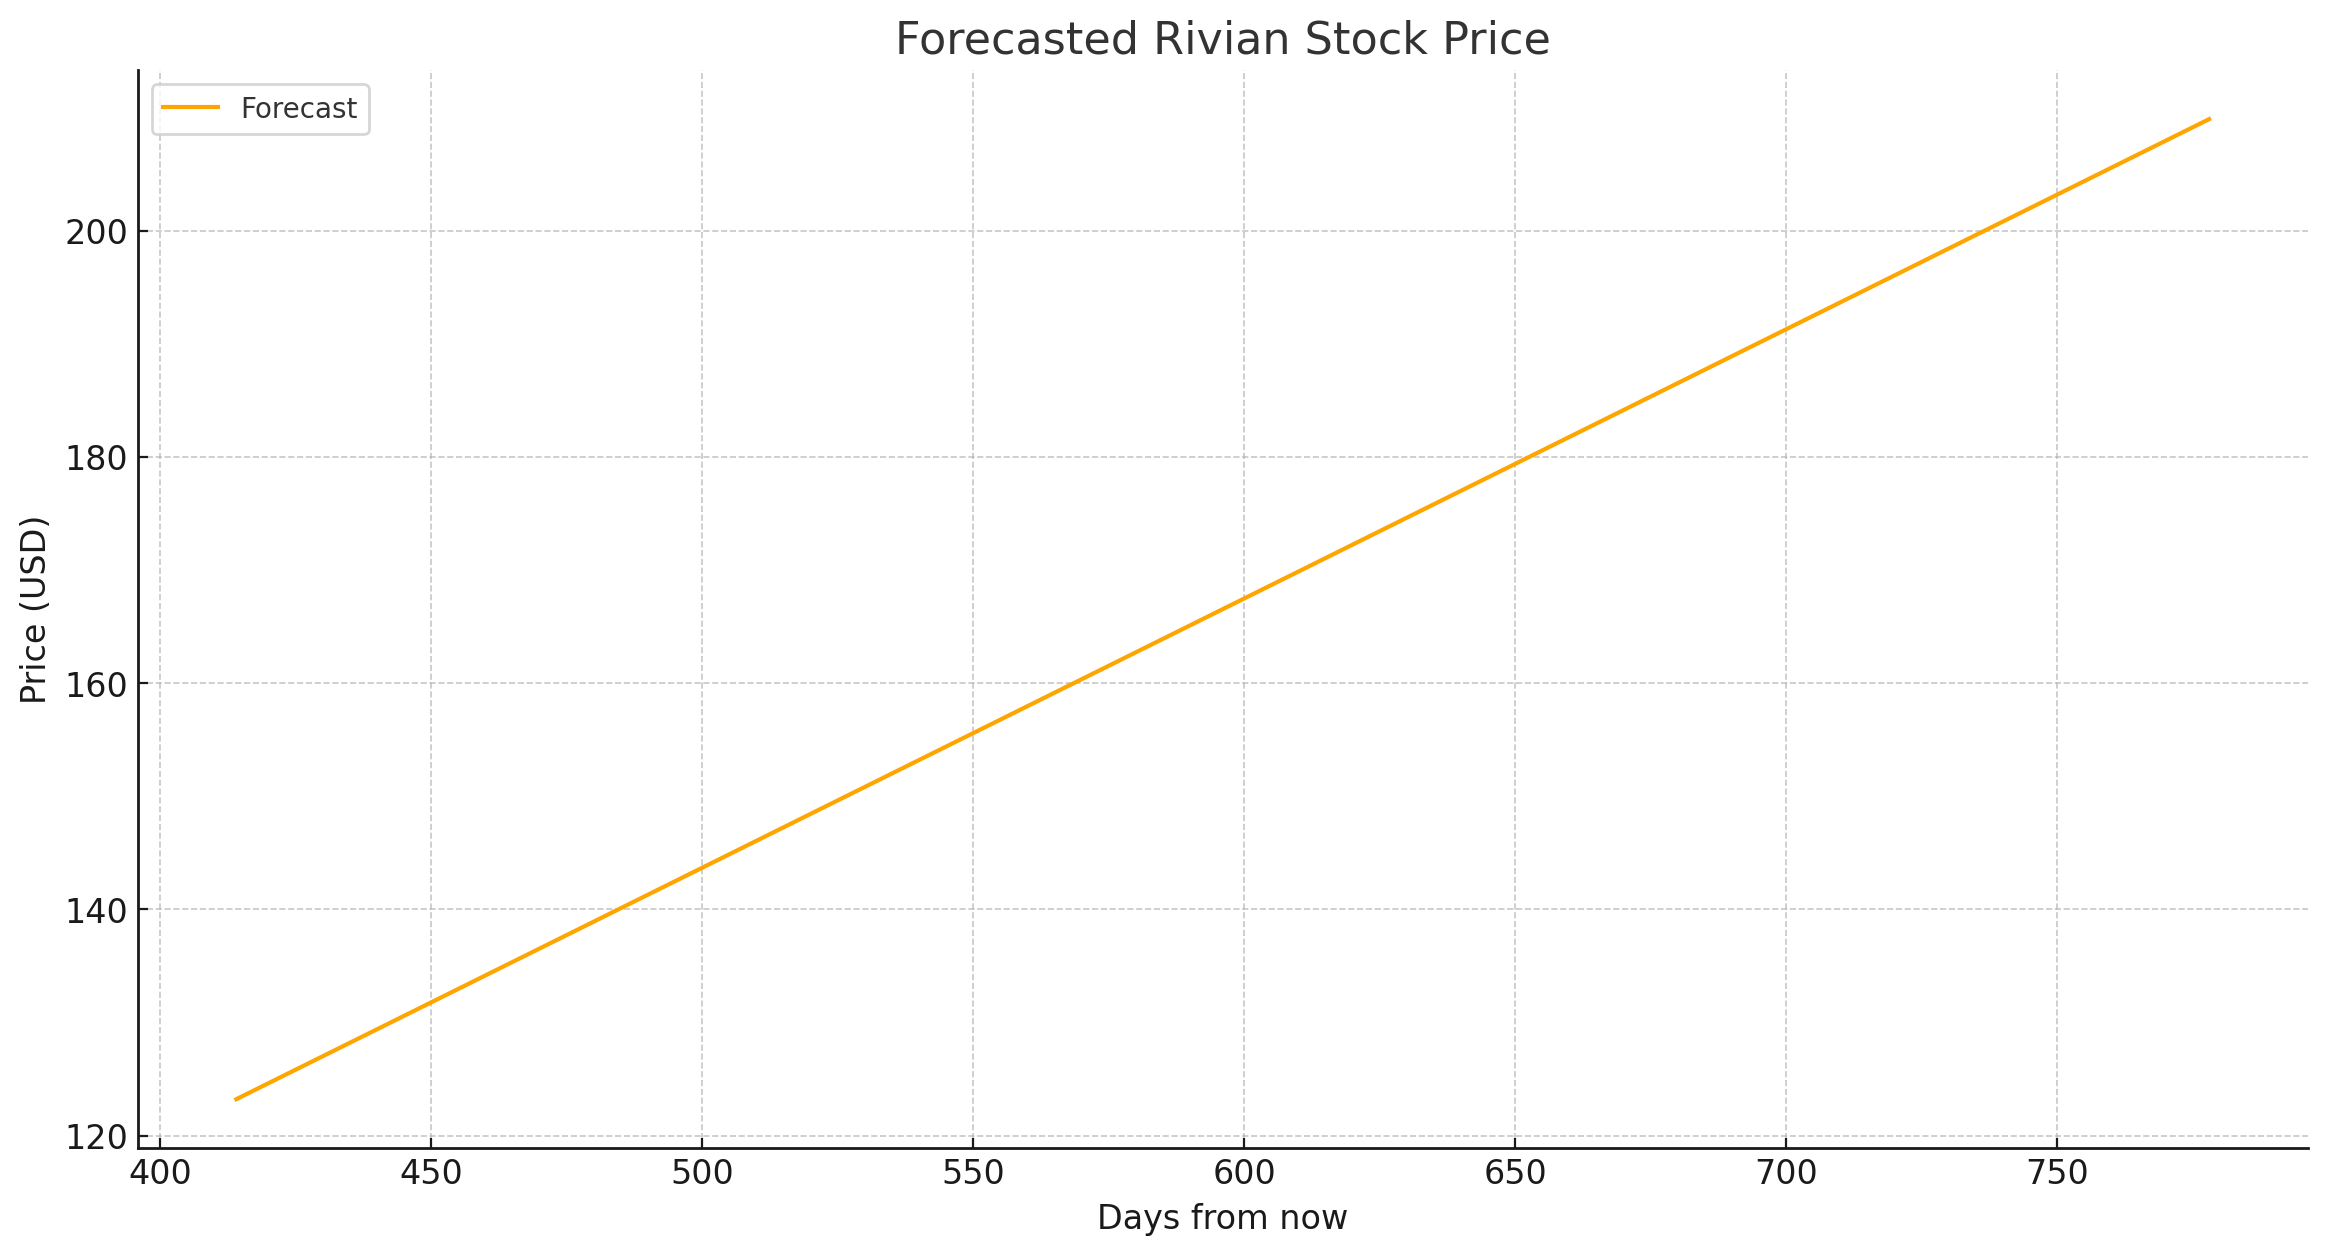
The model predicts a steady trend over the forecast period. However, these are statistical predictions based on past data, and actual future prices may vary due to a multitude of unpredictable factors.
Visual Representations of the Predictions
Several visual representations were created to illustrate the forecasted prices:
- Line plot: This plot shows the original closing prices and the forecasted prices, providing a visual comparison of the actual prices and the model’s predictions.
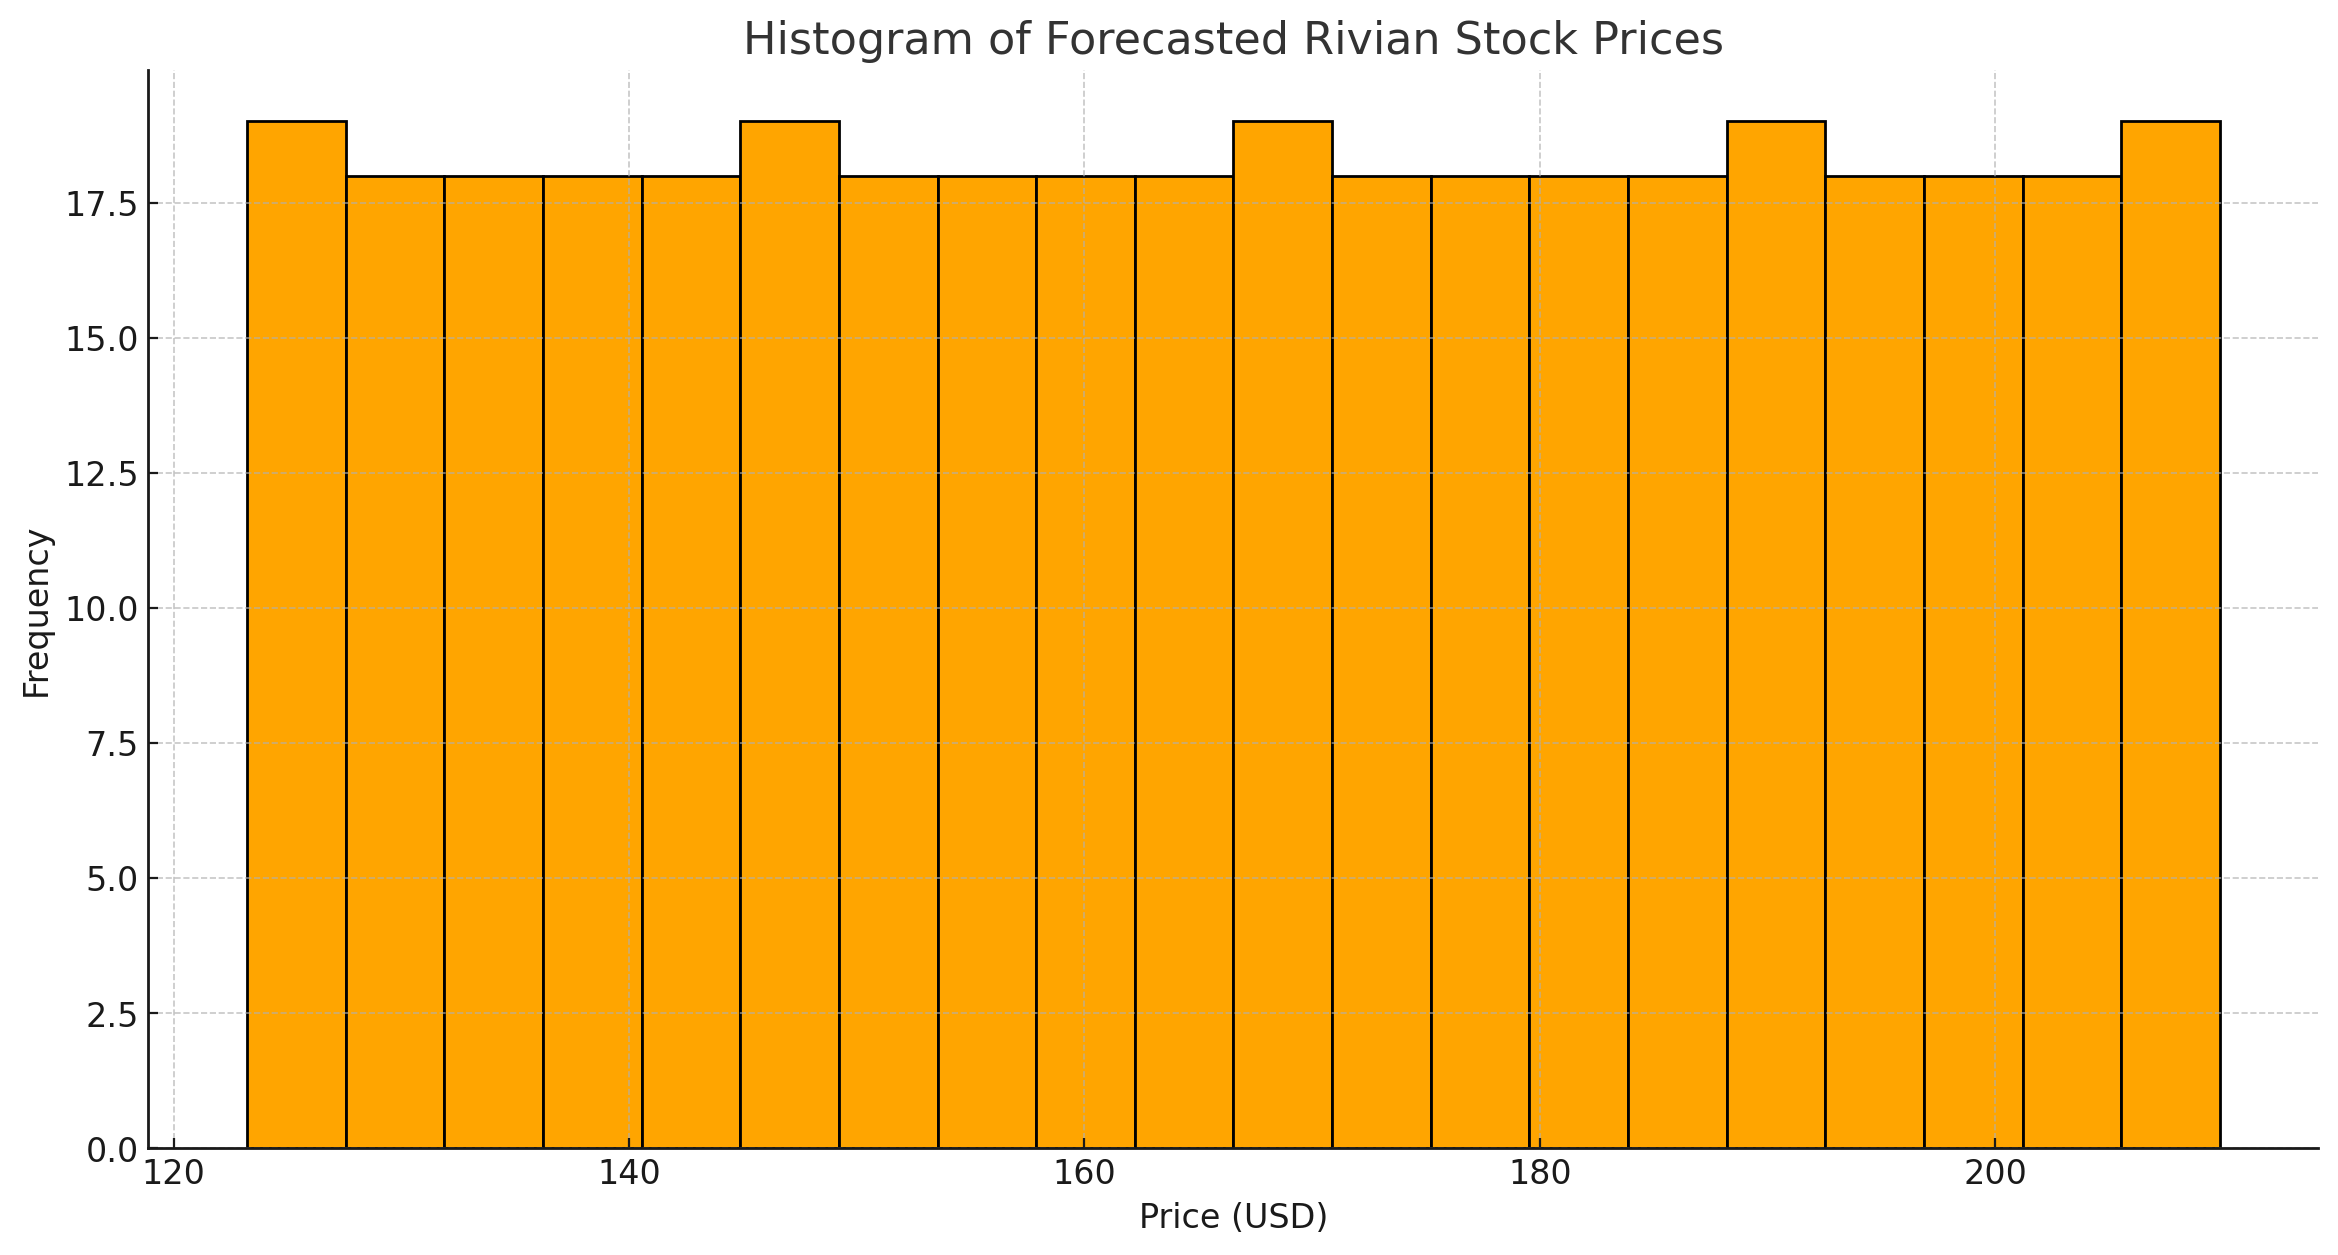
- Histogram: This plot provides a visual representation of the distribution of the forecasted prices, showing how frequently different price levels are expected to occur.
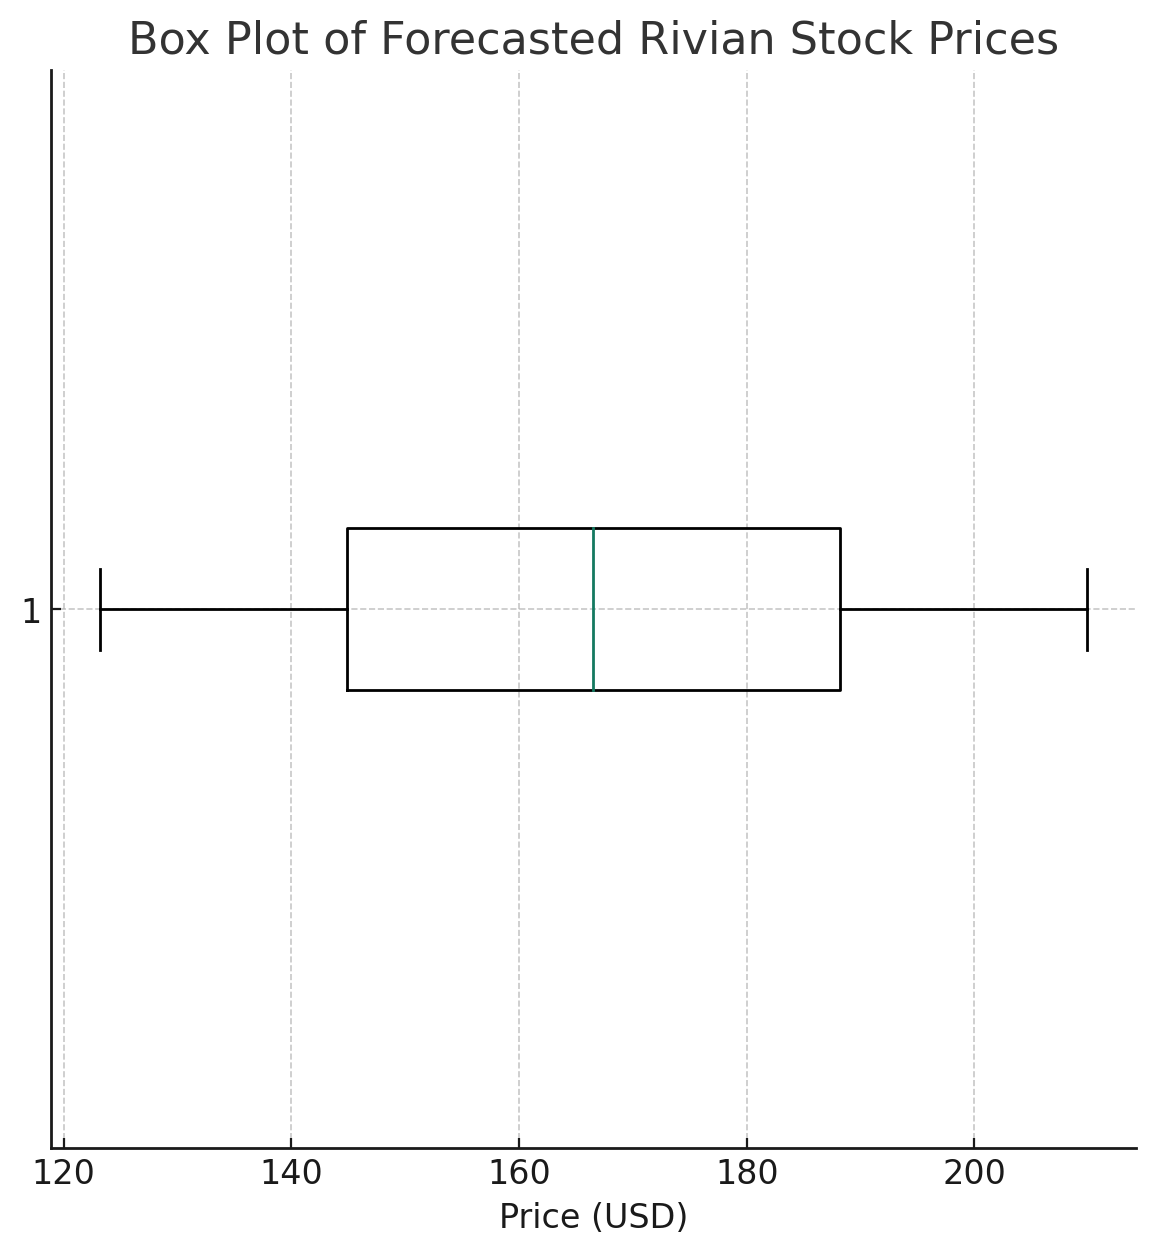
- Box plot: This plot provides a summary of the forecasted prices, showing the median, quartiles, and potential outliers.
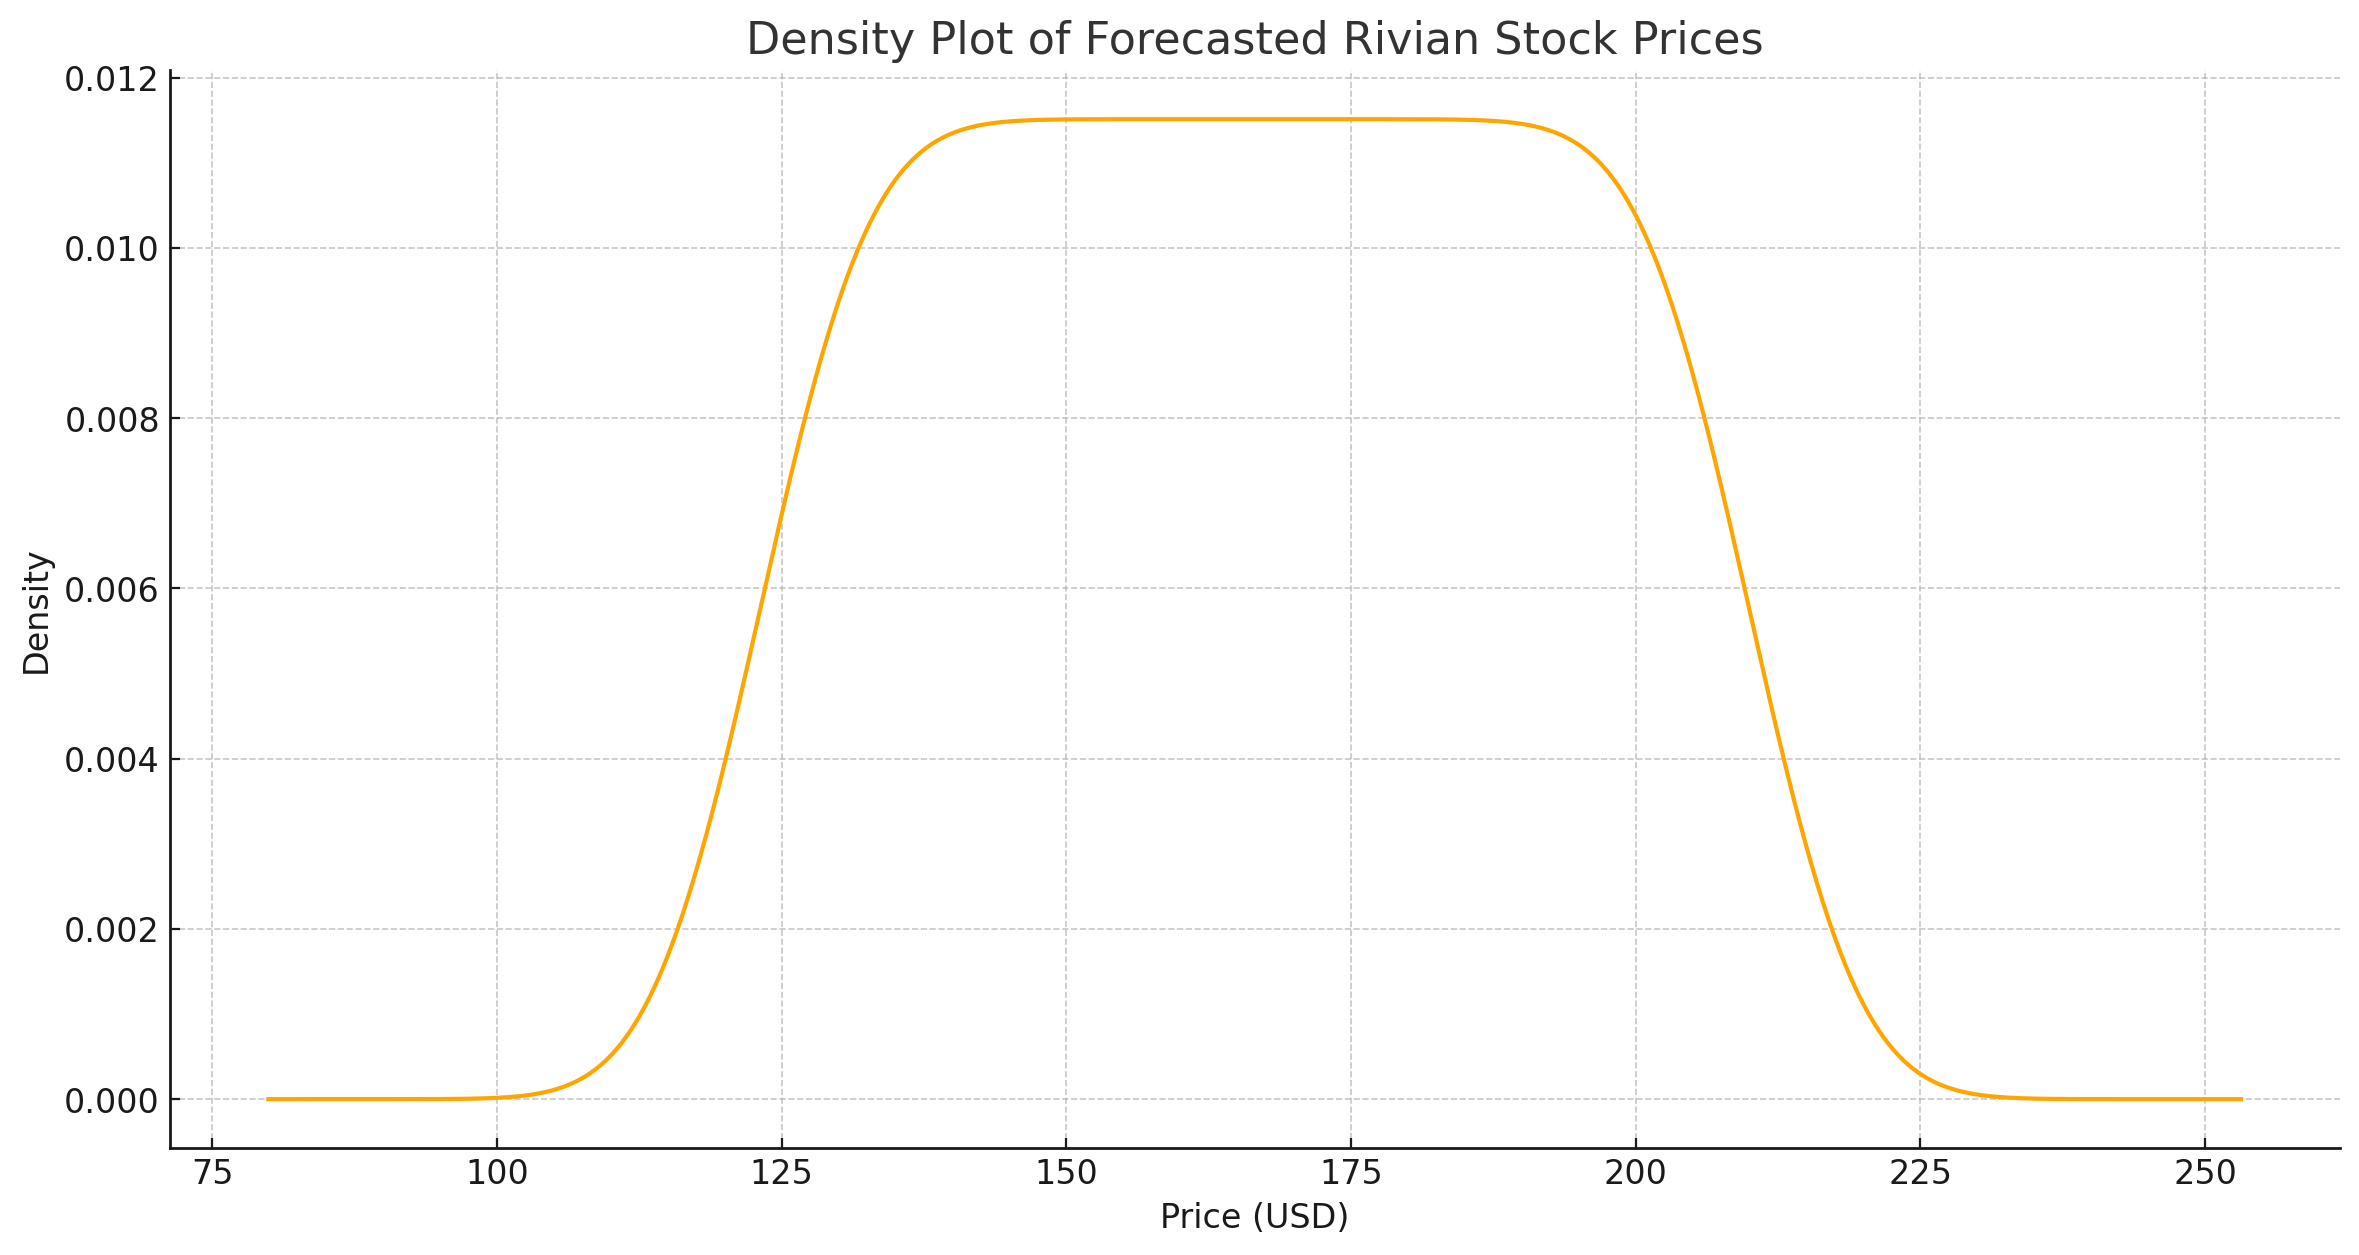
- Density plot: This plot provides a smoothed estimate of the distribution of the forecasted prices.
Each of these graphs offers a different perspective on the forecasted prices and can help in understanding the model’s predictions. However, they all show predictions based on past data and do not account for future events that may significantly impact stock prices.
In the next part of the article, we will conclude with a summary of the findings and a crucial disclaimer.
Summary of the Findings
The analysis used the Exponential Smoothing model to forecast the closing prices of Rivian’s stock for the next 365 days. The model predicted a steady trend, which was visualized through various graphs including a line plot, histogram, box plot, and density plot. The predicted prices and visual representations provide an estimate of how the stock prices might evolve based on past data.
Disclaimer
It’s crucial to acknowledge the uncertainties inherent in stock price predictions. Stock prices are influenced by a myriad of factors, many of which are unpredictable and not accounted for in this analysis. These include economic indicators, market sentiment, company-specific news, and global events, among others.
Therefore, while this analysis provides a statistical forecast based on historical data, it should not be used for investment decisions. Investment decisions should consider a comprehensive range of factors and ideally be guided by professional financial advice. This analysis is intended to demonstrate a methodology for time series forecasting and should not be taken as financial advice.