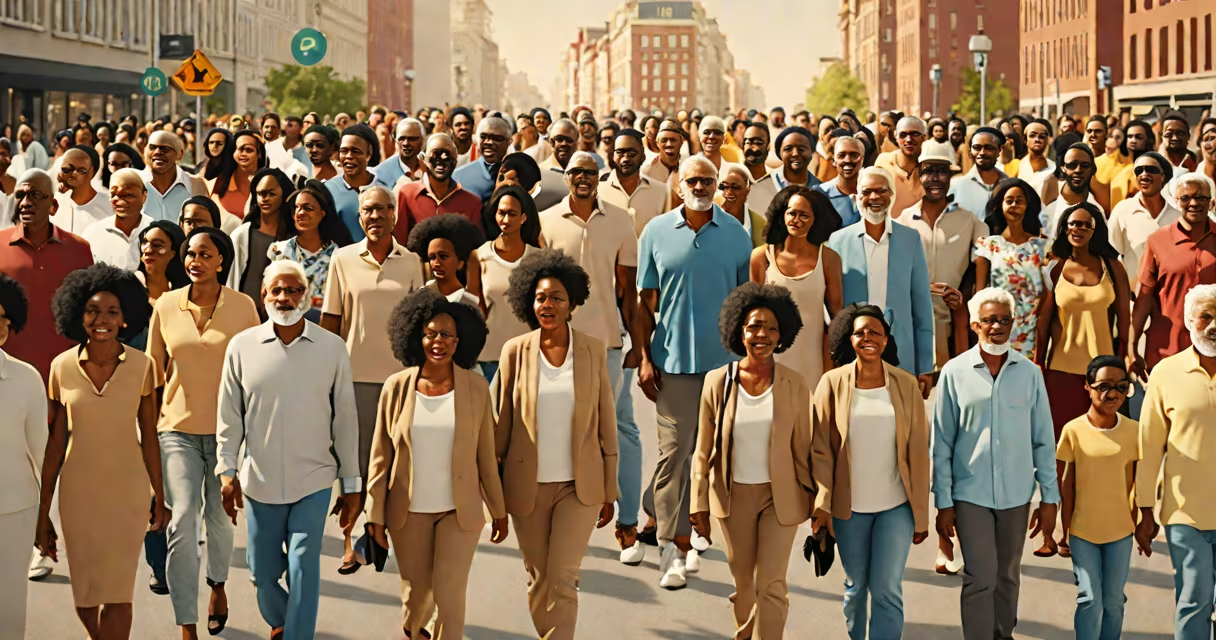
Demographic information describes measurable traits of a population, including age, gender, race, income level, education, occupation, and geographic location. It provides a statistical snapshot used to understand social patterns, allocate resources, and inform decisions across public and private sectors.
This data is collected through surveys, censuses, and administrative records. It's not personal identifying information unless linked to individual identifiers. For example, knowing that 62% of residents in a U.S. county are between 25 and 44 years old is demographic data-without revealing who those individuals are.
According to the U.S. Census Bureau, demographic data forms the foundation of federal planning, including infrastructure funding and healthcare allocation. The National Center for Health Statistics uses it to track disease prevalence across age groups and regions. These institutions rely on standardized definitions to ensure consistency across reports.
Demographic information functions by categorizing people into groups based on shared attributes. Each category is defined by specific criteria. For example, "income level" may be divided into low (<$30,000), middle ($30,000–$100,000), and high (> $100,000) brackets, using thresholds set by the U.S. Department of Labor.
Data collection methods include household surveys, online forms, and automated record matching. The U.S. Census Bureau conducts a decennial census and monthly Current Population Survey. These tools gather data on employment, housing, and family structure. Results are published in detailed reports such as the American Community Survey (ACS).
When aggregated, demographic data enables trend analysis. A city planner might compare 2010 and 2020 census data to see how the median age in a neighborhood shifted from 34 to 41. That change signals aging populations and potential demand for senior services.
Demographic information typically includes five core categories:
| Type | Definition | Example |
|---|---|---|
| Age | Years since birth, often grouped into ranges | 18-24, 25-34, 35-44 |
| Gender | Self-reported sex assigned at birth or gender identity | Male, Female, Non-binary, Prefer not to say |
| Race/Ethnicity | Self-identified racial or ethnic group | White, Black or African American, Hispanic or Latino, Asian |
| Income | Household or individual earnings within a period | $50,000-$75,000 annually |
| Education Level | Formal academic attainment | High school diploma, Bachelor's degree, Postgraduate |
Some datasets also include marital status, household size, and migration history. The U.S. Census Bureau defines these categories using consistent guidelines to allow cross-year comparisons.
A common misconception is that demographic data reflects individual behavior. It does not. A report showing that 47% of adults aged 18-34 in New York City identify as LGBTQ+ does not imply that any single person in that group identifies that way. The numbers describe group distributions, not personal choices.
Public health agencies use demographic information to target outreach. The Centers for Disease Control and Prevention (CDC) relies on age and race data to prioritize flu vaccination campaigns. In 2022, they focused outreach on Black and Hispanic communities due to higher hospitalization rates during winter months.
Businesses use it for market segmentation. A retail chain analyzing store performance might find that customers aged 35-54 in suburban areas spend 30% more on home goods than younger urban shoppers. This insight leads to tailored product placement and advertising.
Nonprofits use demographic data to assess community needs. A food bank in Detroit reviewed ZIP code-level data and discovered that 28% of residents in one district lived below the poverty line. They expanded meal distribution to that area, increasing service access by 40% over six months.
One non-obvious fact: demographic data can reveal disparities masked by averages. In 2019, the average U.S. household income was $68,703. But when broken down by race, White households earned $88,000 on average, while Black households earned $45,000. This gap influences wealth accumulation and intergenerational mobility.
People often confuse demographic information with psychographic data. While demographics describe "who," psychographics explore "why." For example, knowing that 60% of voters in a state are women aged 45-64 is demographic. Understanding that they prioritize healthcare reform due to personal experiences with insurance denial is psychographic.
Another error is assuming demographic data is always accurate. Self-reported survey data can suffer from underreporting or bias. A 2021 study in *Social Science Research* found that 12% of respondents misreported their race when surveyed online. Researchers account for this by weighting responses and validating against external sources.
I once analyzed a dataset for a nonprofit focused on youth employment. The initial report showed that 68% of job seekers were male. After cross-checking with local labor office records, we found the actual figure was 54%. The discrepancy came from a survey design that asked males to self-identify first, leading to overreporting. Adjusting the question order corrected the bias.