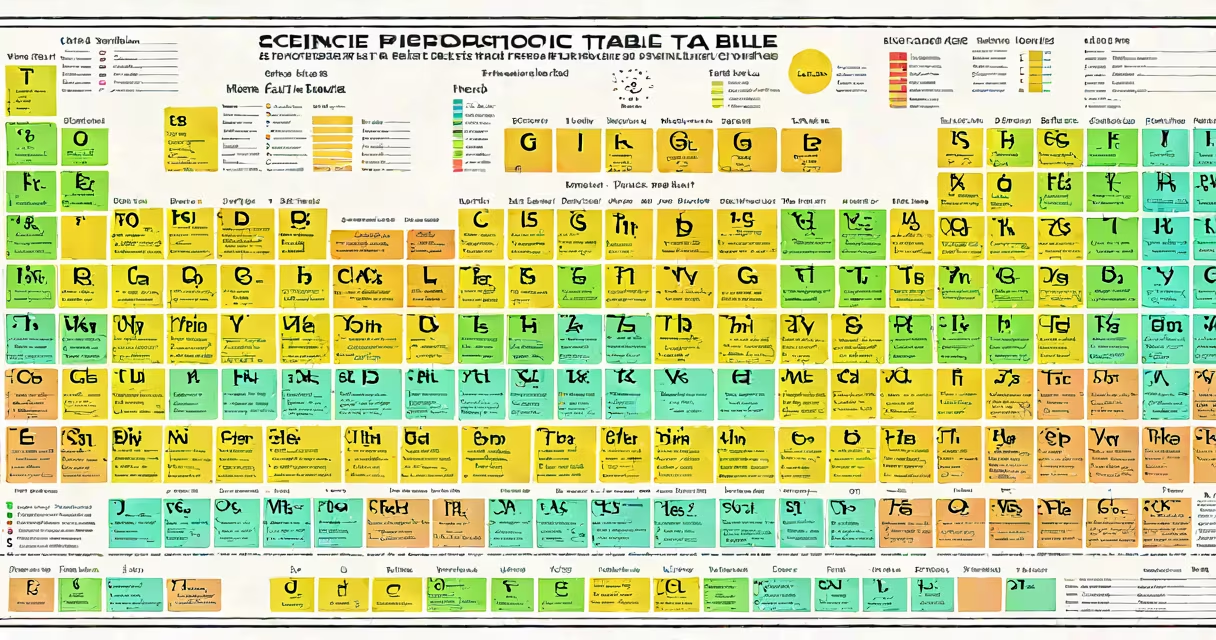
The science chart periodic table is a structured arrangement of all known chemical elements ordered by increasing atomic number, electron configuration, and recurring chemical properties. It groups elements into rows (periods) and columns (groups), revealing trends in reactivity, electronegativity, and atomic size.
Elements appear in order of rising atomic number-the number of protons in the nucleus. Hydrogen (atomic number 1) begins the table, followed by helium (2), lithium (3), and so on. This sequence reflects the building-up of electron shells. Elements in the same column share similar valence electron configurations, leading to comparable chemical behavior. For example, all elements in Group 1 (alkali metals) have one electron in their outermost shell and react vigorously with water.
Each cell contains the element's symbol, atomic number, and average atomic mass. The layout divides elements into metals (left side), metalloids (diagonal line), and nonmetals (right side). Transition metals occupy the central block, while inner transition metals (lanthanides and actinides) are placed below the main body. This design allows scientists to predict how elements will interact and form compounds.
The periodic table functions as a predictive tool based on quantum mechanics and electron orbitals. As electrons fill energy levels, they determine an element's position. The table's structure aligns with the Aufbau principle, which states that electrons occupy the lowest available energy level first. This explains why elements in the same group exhibit similar bonding behaviors.
For example, fluorine (F, atomic number 9) has seven valence electrons and gains one electron to achieve a stable octet. Chlorine (Cl, 17), in the same group, behaves identically-forming Cl⁻ ions in salts. This pattern repeats across halogens (Group 17), making the table essential for forecasting reactivity.
Periodic trends include decreasing atomic radius across a period due to increased nuclear charge pulling electrons closer. Ionization energy increases left to right, while electronegativity follows the same trend. These patterns help explain why sodium (Na) donates an electron easily, forming Na⁺, while chlorine accepts one to become Cl⁻-leading to ionic bond formation in sodium chloride.
While the standard periodic table is most common, several formats exist to emphasize different aspects of elemental relationships.
| Type | Focus | Use Case |
|---|---|---|
| Standard (18-column) | Electron configuration, group trends | High school and university chemistry courses |
| Extended (32-column) | Full placement of lanthanides/actinides | Advanced inorganic chemistry research |
| Left-step | Groups elements by electron shell filling order | Highlighting periodicity beyond traditional blocks |
| 3D or spiral | Visualizing element progression in space | Scientific visualization and educational tools |
One non-obvious distinction: the placement of hydrogen remains debated. Though in Group 1, hydrogen lacks metallic properties and forms covalent bonds like nonmetals. Some tables place it above lithium, others above fluorine. This ambiguity underscores that the periodic table is both a scientific model and a human-designed structure.
Many assume the periodic table was created by Dmitri Mendeleev in 1869 as a complete blueprint. While he predicted undiscovered elements like gallium and germanium with notable accuracy, the table evolved after his time. Modern versions incorporate isotopes, electron spin, and relativistic effects in heavy elements.
Another misconception: all elements are naturally occurring. Over 90% of elements are found in nature, but synthetic elements such as plutonium (Pu, 94) and oganesson (Og, 118) are produced in particle accelerators. These elements decay rapidly and do not exist in bulk outside labs.
A third error is equating element symbols with pronunciation. Iron is Fe (from Latin ferrum), not "eye-on." Mercury is Hg (hydrargyrum), not "mer-kur-ee." Misreading symbols leads to confusion in lab work and academic writing.
In materials science, the periodic table guides alloy development. Titanium (Ti, 22) combines with aluminum and vanadium to create lightweight, high-strength alloys used in aerospace engineering. Engineers select elements based on melting points, density, and corrosion resistance-all predictable through periodic trends.
Consider lithium-ion batteries. Lithium (Li, 3) is chosen because it has the highest electrochemical potential per unit mass among metals. Its low atomic weight and high ion mobility make it ideal for portable electronics. The periodic table shows this choice is not arbitrary-it reflects lithium's position in Group 1 and its small ionic radius.
Here's a worked example: predicting the reaction between calcium (Ca, 20) and oxygen (O, 8). Calcium is in Group 2, with two valence electrons. Oxygen is in Group 16, needing two electrons to complete its octet. They form CaO via ionic bonding. The periodic table confirms this outcome: metals lose electrons, nonmetals gain them. The resulting compound is stable due to lattice energy, a property calculable using periodic trends.
During a lab experiment, I observed that potassium (K, 19) reacts violently with water, producing hydrogen gas and heat. Sodium (Na, 11) does the same-but less intensely. The difference lies in atomic size and ionization energy. Potassium is larger, so its outer electron is farther from the nucleus and easier to remove. This pattern holds across Group 1: reactivity increases down the group. The science chart periodic table makes this observable trend visible.
The International Union of Pure and Applied Chemistry (IUPAC) maintains the official periodic table and approves new element names and symbols. Their 2016 announcement of nihonium (Nh), moscovium (Mc), tennessine (Ts), and oganesson (Og) confirmed the completion of Period 7. IUPAC's standards ensure consistency across global scientific communication.
The Royal Society of Chemistry provides detailed element data, including electron configurations and physical properties. Their online periodic table includes interactive features showing melting points, boiling points, and thermal conductivity-all derived from experimental measurements and quantum calculations.
When studying the science chart periodic table, remember that it is not static. New elements continue to be synthesized, and theoretical models suggest a "island of stability" near element 114, where certain superheavy nuclei may last longer due to closed proton and neutron shells. This ongoing evolution proves the table's enduring relevance.
Understanding the science chart periodic table enables accurate prediction of chemical behavior, efficient material selection, and informed experimentation. Whether analyzing battery components or identifying unknown substances, this tool remains foundational to chemistry and related sciences.