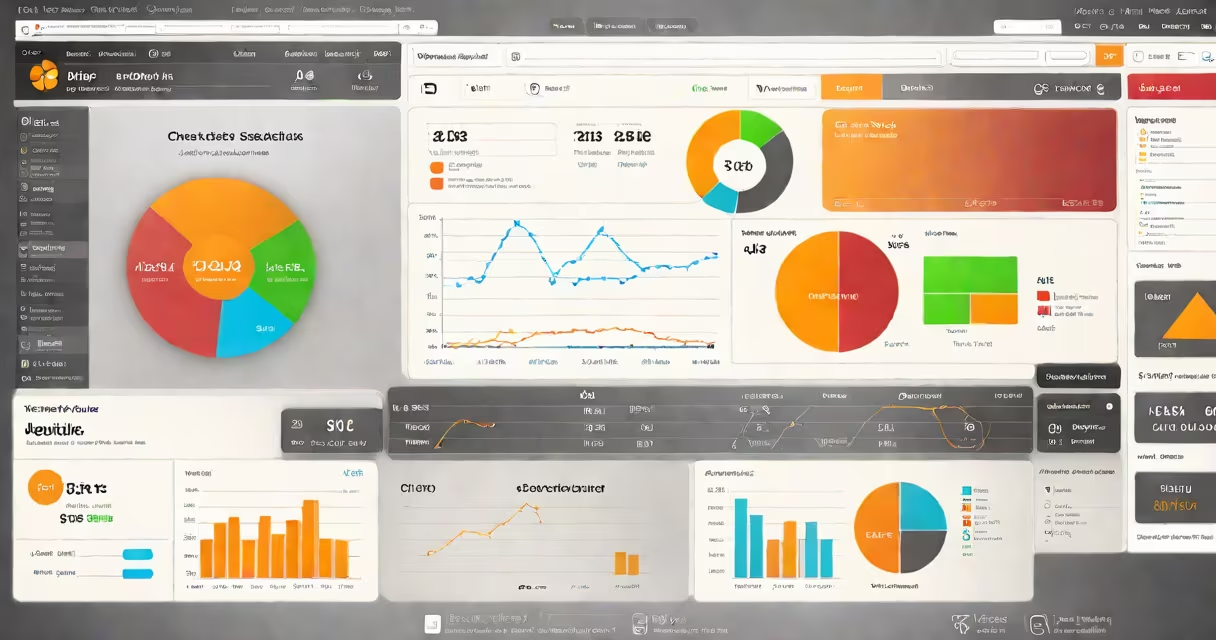
Mobile analytics tools collect, process, and visualize user behavior within mobile applications to measure engagement, identify drop-off points, and inform product improvements. They track actions like screen views, button taps, session duration, and in-app purchases across iOS and Android platforms.
These tools work by embedding a software development kit (SDK) into an app's codebase. Once integrated, the SDK captures anonymized event data-such as when a user opens a feature or exits the app-and sends it to a central server. The server processes this data, then displays insights through dashboards with visualizations like funnels, heatmaps, and cohort reports.
Major providers include Google Analytics for Firebase, Mixpanel, Amplitude, and Segment. Each offers different strengths: Firebase excels in real-time reporting and integration with Google Cloud; Mixpanel specializes in behavioral segmentation; Amplitude focuses on product lifecycle analysis; and Segment acts as a data pipeline that routes events to multiple destinations.
The core workflow begins with instrumentation-the addition of tracking code to specific app screens or functions. For example, a developer might tag a "Checkout" button with an event called "purchase_initiated." When a user taps it, the SDK logs the event along with metadata such as device type, location, and time of day.
Data flows through a pipeline: client-side collection → secure transmission → server processing → visualization. Most tools support custom events, allowing teams to define their own metrics beyond standard behaviors. This flexibility enables tracking of unique business logic, such as completing a tutorial or sharing content via social media.
Processing happens in near real time. A user who completes a purchase at 2:15 PM appears in the dashboard within 60 seconds. This immediacy supports rapid iteration-product managers can spot issues like a 40% failure rate during login and deploy fixes within hours.
Mobile analytics tools vary by focus area. The following table outlines major categories and representative platforms:
| Type | Purpose | Examples |
|---|---|---|
| Event-based analytics | Tracks user actions like clicks, swipes, or form submissions | Mixpanel, Amplitude |
| Session and funnel analysis | Measures how users progress through multi-step processes | Google Analytics for Firebase, Adjust |
| Retention and cohort analysis | Identifies how many users return after Day 1, Day 7, etc. | Localytics, CleverTap |
| Crash and performance monitoring | Detects app crashes, slow load times, and memory leaks | Sentry, AppDynamics |
Some tools combine multiple functions. Firebase, for instance, tracks both user behavior and app stability. Others specialize-Segment routes raw event data to downstream systems like Salesforce or Snowflake, acting as a central hub rather than a visualization engine.
A common misconception is that all mobile analytics tools provide equal insight depth. In reality, free versions often limit data retention to 90 days and cap monthly active users at 10,000. Paid tiers enable advanced features like predictive modeling and cross-device identification. Teams must evaluate scale and feature needs before selecting a platform.
Product teams use mobile analytics tools to reduce user churn. A fitness app noticed a 65% drop-off between signing up and completing the first workout. Analysis revealed that users were stuck on a video tutorial that failed to load on older Android devices. After optimizing video delivery, completion rates rose by 32% within two weeks.
Marketing departments rely on these tools to measure campaign effectiveness. An e-commerce app ran a push notification campaign promoting a weekend sale. By comparing traffic from the notification versus organic sources, they found that users who clicked had a 2.4x higher conversion rate. This insight led to increased budget allocation for targeted messaging.
One limitation often overlooked is data accuracy. If the SDK isn't properly initialized or if network errors occur, events may be lost. A team using Mixpanel discovered that 12% of "add_to_cart" events weren't being recorded due to a misconfigured callback. After fixing the code, reported conversions increased by 18%. This highlights the need for validation testing during implementation.
I once audited a travel booking app where the analytics setup was inconsistent across regions. Users in Southeast Asia saw fewer tracking events than those in North America. The root cause was a regional IP filter blocking data from certain servers. Once corrected, the global view of user behavior became accurate, enabling better localization strategies.
They are not standalone CRM systems. While they capture user interaction data, they don't manage customer relationships or handle communication workflows. Integrating with tools like HubSpot or Salesforce requires additional configuration.
They are not replacements for web analytics. Mobile-specific behaviors-like swipe gestures, push notification engagement, and offline usage-don't map cleanly to desktop tracking models. A single user might behave differently across devices, requiring separate analysis frameworks.
They do not automatically fix problems. Identifying a high drop-off rate at step three of a registration flow doesn't resolve the issue-it only signals it exists. Product teams still need to conduct usability tests, gather feedback, and iterate on design.
Understanding the difference between event tracking and attribution is important. Event tracking measures what users do inside the app. Attribution determines which marketing channel brought them there. Tools like AppsFlyer or Branch specialize in attribution, while others like Amplitude focus on in-app behavior. Using both together gives a complete picture of the user process.
Mobile analytics tools are essential for measuring success in a competitive app market. Without them, teams operate without visibility into how users interact with their product. The ability to see exactly where users succeed or fail allows for faster decision-making, better prioritization, and improved long-term value.