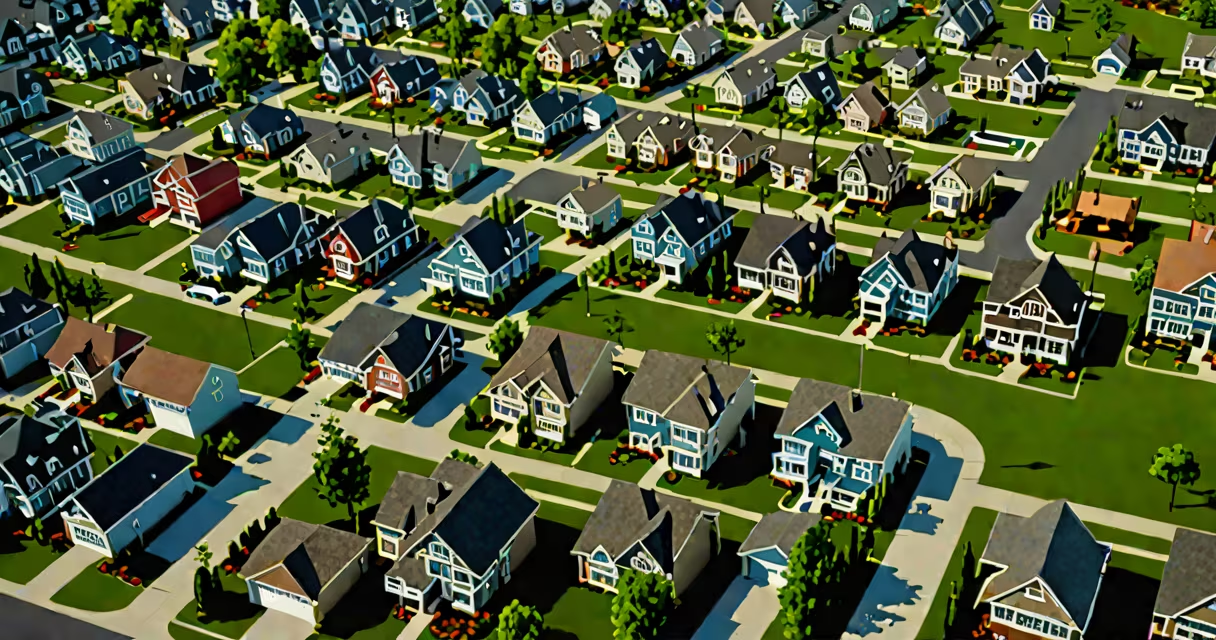
The U.S. housing market in 2024 is marked by rising home prices, persistently high mortgage rates, and declining sales volume due to affordability constraints. Inventory remains tight, especially in desirable metropolitan areas, while regional disparities in price growth are widening.
Home prices rose 4.1% year-over-year in the first quarter of 2024, according to the S&P CoreLogic Case-Shiller U.S. National Home Price Index. This follows a 3.8% increase in Q4 2023. Despite higher borrowing costs, demand continues to outpace supply in many markets, pushing values upward. The median existing-home sale price reached $426,000 in March 2024, up 4.3% from the previous year, per the National Association of Realtors (NAR).
Mortgage rates have stabilized around 7%, up from 3.2% in early 2022. This shift has reduced buyer purchasing power. A borrower earning $75,000 annually can afford approximately $350,000 in home value at 7% interest, compared to $500,000 at 3.2%. This gap limits entry for first-time buyers and increases competition among qualified buyers.
The housing market operates on supply and demand dynamics, influenced by financing conditions, population movement, and inventory levels. With nearly 12 million homes sold since 2010, the current cycle differs from past booms due to structural supply shortages.
Builders are constructing homes at a rate of 1.4 million units annually, below the 1.6 million needed to meet demand, according to the U.S. Census Bureau. This deficit stems from labor shortages, zoning restrictions, and land availability issues. As a result, new construction accounts for only 30% of total housing starts, down from 45% in the 1990s.
When demand exceeds supply, prices rise. In 2024, 54% of surveyed markets reported price gains above 5%, led by Sun Belt cities such as Phoenix (+8.2%), Austin (+7.9%), and Tampa (+7.1%). These gains are driven by migration from higher-cost states like California and New York, where housing is less affordable.
The housing market includes multiple segments: single-family homes, condos, townhouses, and rental properties. Each segment responds differently to economic shifts.
| Type | Price Change (YoY) | Inventory Level | Buyer Demand |
|---|---|---|---|
| Single-family homes | +4.3% | Low (1.7 months' supply) | High (68% of buyers prefer this type) |
| Condos | +2.9% | Average (3.2 months' supply) | Steady (21% of buyers) |
| Townhomes | +5.7% | Low (1.9 months' supply) | High (11% of buyers) |
Data from NAR's Q1 2024 report shows that 68% of buyers are targeting single-family homes, which remain the most sought-after category. Condos have seen slower appreciation due to lower supply and higher maintenance fees. Townhomes, often positioned between condos and single-family homes, are gaining traction in urban-suburban transition zones.
Investors are active in certain markets. In 2024, investors purchased 18% of homes sold, up from 13% in 2020. They favor markets with high rental yields, such as Charlotte (6.8%) and Nashville (6.2%), where property appreciation supports long-term returns.
Many assume that rising home prices indicate a bubble. However, the Federal Reserve's 2024 Financial Stability Report notes that price-to-income ratios remain within historical norms. Median home prices are 4.2 times median household income nationally, compared to 4.5 in 2006 - below the peak level that preceded the 2008 crash.
Another misconception is that low inventory reflects poor market health. In reality, low inventory signals strong demand. The national average days-on-market for homes was 38 days in March 2024, down from 48 in 2022. Homes selling quickly often attract multiple offers, sometimes above asking price.
In Atlanta, median home prices increased from $385,000 in January 2023 to $421,000 in January 2024 - a 9.4% rise. Mortgage rates averaged 6.9% during that period. Despite this, 52% of homes sold within 30 days, and 37% received multiple offers.
A first-time buyer earning $85,000 annually qualified for a loan of $430,000 at 7% interest. After a 10% down payment ($43,000), their monthly principal and interest payment was $2,870. Property taxes and insurance added $650, bringing total housing costs to $3,520. This represented 41% of gross monthly income - above the recommended 30% threshold.
This example illustrates the affordability challenge. Even with stable employment, buyers face financial strain. The solution often involves larger down payments, co-signers, or targeting less expensive neighborhoods.
The housing market is not uniform. While national averages suggest moderate growth, local conditions vary widely. Buyers in high-demand areas may face bidding wars, while sellers in lower-tier suburbs struggle to find offers.
One non-obvious factor is the role of refinancing. With 30-year fixed rates near 7%, homeowners with 3.5% mortgages are unlikely to refinance. This locks in low rates and reduces turnover, contributing to low inventory. The Federal Reserve estimates that 15 million homeowners are "rate-locked," meaning they won't sell unless prices rise further to justify moving.
I observed this firsthand in early 2024 while attending a homebuyer workshop in Denver. A couple with a 3.2% mortgage refused to sell their home despite wanting to move to a larger property. Their equity was $220,000, but the cost of buying a new home at current rates exceeded their budget. They delayed relocation until rates dropped or prices stabilized.
Understanding the housing market doing right now requires separating headline numbers from underlying realities. Prices are rising, but affordability is declining. Supply is insufficient, yet demand persists. The market is not collapsing - nor is it booming. It is adjusting to a new equilibrium shaped by finance, demographics, and policy.