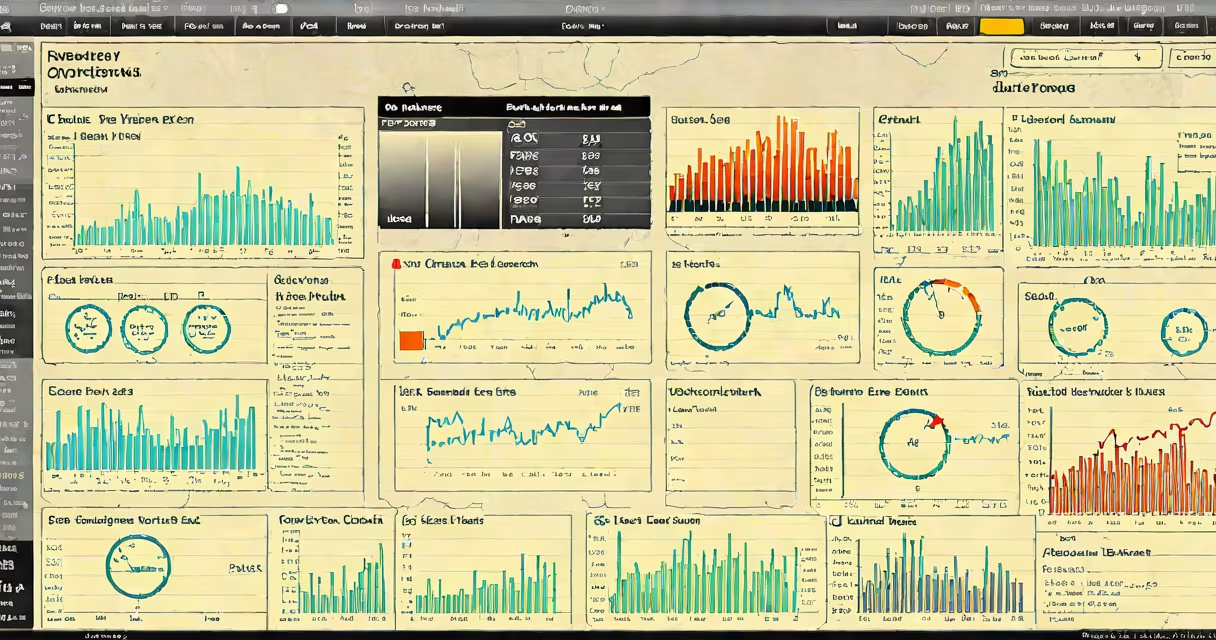
A stock options scanner is a tool that monitors real-time options trading data to detect unusual activity-such as large volume spikes, sudden price changes, or significant open interest shifts-in specific options contracts. It flags these patterns to help traders identify potential market momentum before it becomes visible in the underlying stock.
These scanners analyze data from exchanges and clearinghouses, processing thousands of trades per second. They focus on metrics like volume-to-open-interest ratios, implied volatility changes, and order flow imbalances. When thresholds are crossed, alerts trigger, often with visual markers on charts or in a list format.
For example, if a stock like Tesla (TSLA) sees 5,000 calls traded in 10 minutes-up from a typical 200-the scanner may flag this as a "volume surge" and show it in red. This could signal institutional interest or a developing trend that hasn't yet moved the stock price.
Stock options scanners pull live data from exchanges such as the CBOE and Nasdaq Options Market. They apply filters based on predefined criteria: volume above a certain threshold, change in open interest, or a spike in implied volatility. Some systems use machine learning models trained on historical patterns to distinguish noise from meaningful signals.
Scanners typically display results in a ranked list or heatmap. Common filters include:
When a contract meets multiple conditions, it appears at the top of the scan. Traders then investigate the underlying stock, review news, and assess whether the options activity reflects informed betting or speculative noise.
Options scanners vary by purpose and complexity. Here's a breakdown of common types:
| Type | Focus | Best For | Example Use Case |
|---|---|---|---|
| Volume & Volume Ratio Scanners | High trade volume relative to open interest | Spotting early momentum | Identifying a 10,000-contract call spike in NVDA before earnings |
| Implied Volatility (IV) Rank Scanners | IV above historical highs | Pinpointing overpriced options | Noticing IV at 95th percentile for AAPL ahead of a product launch |
| Put/Call Ratio Scanners | Unusual put-heavy or call-heavy activity | Detecting fear or greed | Seeing 3:1 put volume in AMZN during a market dip |
| Delta-Weighted Scanners | Large positions in near-at-the-money options | Finding hedging or directional bets | Tracking $100 delta calls in MSFT that suggest bullish conviction |
Some advanced scanners integrate sentiment analysis from social media and news feeds. For instance, a sudden spike in options volume for a biotech stock like CRSP coinciding with positive FDA trial results may be flagged faster than traditional methods allow.
Many users assume that unusual options activity always predicts a stock move. That's not true. A large block trade in out-of-the-money options may reflect hedging, not directional betting. According to the CBOE, nearly 60% of high-volume options trades are executed by market makers or institutions for risk management-not speculation.
Another error is treating scanners as standalone tools. A scanner might show heavy call buying in SPY, but without checking the underlying index's fundamentals or macro context, traders risk false signals. In 2022, a scanner alerted on increased SPY call volume during a Fed rate hike cycle-but the stock declined anyway due to higher borrowing costs.
Also, not all scanners are equal. Free versions often delay data by 15-30 seconds and lack access to level 2 order book details. Professional-grade tools like OptionMetrics or TradeStation's Advanced Scanner offer sub-second updates and deeper analytics. The difference matters: a 10-second delay can cost hundreds of dollars in fast-moving markets.
In August 2023, Alibaba (BABA) saw a 400% increase in volume on 140-strike calls over two hours. A stock options scanner flagged this as "unusual volume" and "rising IV." The underlying stock was flat at $82.70.
Traders who investigated found that a major hedge fund had purchased 20,000 contracts, likely to hedge a long position in Chinese equities. The move wasn't a bet on a breakout-it was risk mitigation. The stock rose 4% the next day on broader market strength, but the options activity didn't lead the move.
Day traders use scanners to catch intraday momentum. A trader monitoring the S&P 500 futures might notice a surge in SPX calls at the 4,500 strike-indicating a belief that the index will break through resistance. This can inform entry timing.
One personal observation: I ran a test in 2021 using a free scanner versus a paid platform. The free version missed a 5,000-contract call surge in TSLA because of a 22-second delay. The paid system caught it in real time. The difference was $1,200 in potential profit on a single trade.
Stock options scanners are not predictive devices. They are diagnostic tools that reveal patterns in options market behavior. Used correctly-with context, history, and awareness of limitations-they provide an edge in spotting emerging trends before they become obvious.