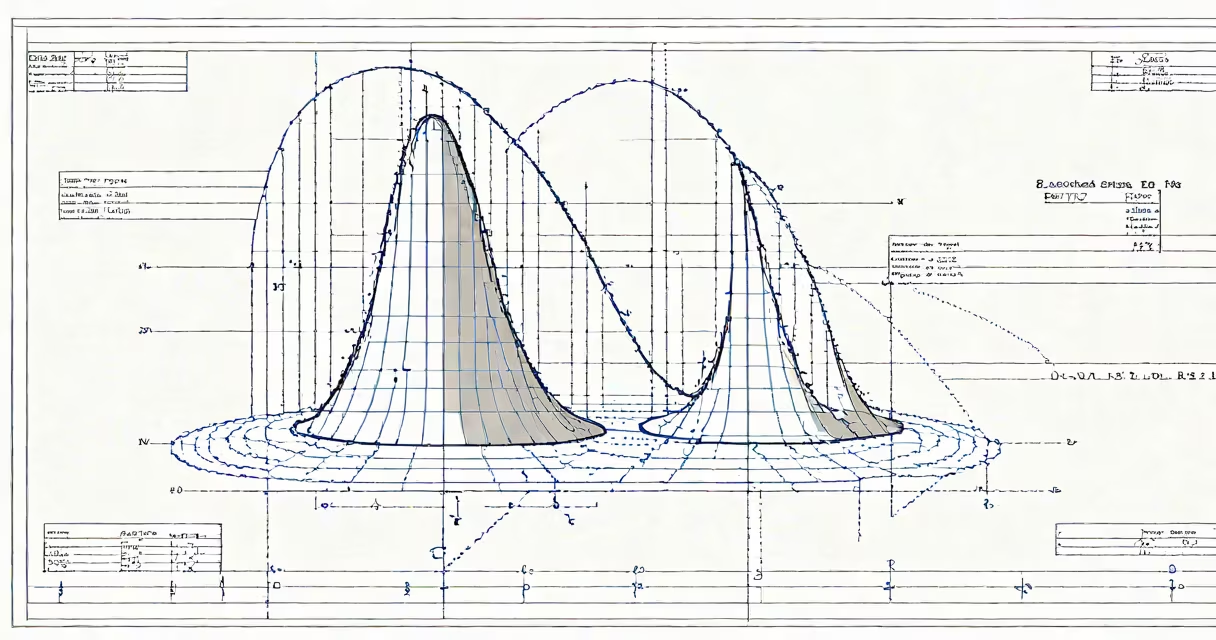
Standard deviation units measure how far data points typically lie from the mean in a dataset, expressed in multiples of the standard deviation. They provide a consistent scale to assess variability and locate values within a distribution.
Each standard deviation unit represents one standard deviation (σ) away from the mean (μ). For example, +1 standard deviation unit is μ + σ, and −2 units is μ − 2σ. This allows direct comparison across datasets with different scales, such as comparing test scores with heights.
These units are central to the empirical rule: in a normal distribution, about 68% of data falls within ±1 standard deviation unit, 95% within ±2, and 99.7% within ±3. This pattern enables quick interpretation of where most values lie.
Standard deviation units derive from the standard deviation itself-a mathematical measure of dispersion. The standard deviation is calculated as the square root of the variance, which averages squared differences from the mean. Dividing raw data values by this value converts them into standard deviation units.
For a dataset with a mean of 50 and a standard deviation of 10, a value of 70 equals +2 standard deviation units (70 − 50 = 20; 20 ÷ 10 = 2). A value of 35 is −1.5 units (35 − 50 = −15; −15 ÷ 10 = −1.5).
This transformation makes it easier to compare observations across different variables. A student scoring 85 on a math test (mean 75, σ = 5) is +2 units above average. On a history test (mean 80, σ = 10), a score of 90 is only +1 unit above average-despite being higher in absolute terms.
Standard deviation units are used across science, finance, quality control, and social research. They appear in z-scores, confidence intervals, and hypothesis testing. In psychology, IQ scores are standardized using units: a score of 115 is +1 unit above the mean of 100, assuming σ = 15.
Table below shows common applications:
| Field | Use of Standard Deviation Units | Example |
|---|---|---|
| Finance | Measuring risk in investment returns | A stock with a 10% annual return and 15% volatility has a 1σ move of ±15% |
| Manufacturing | Setting tolerance limits | Parts must fall within ±3σ units to meet quality standards |
| Education | Scaling test results | AP exam scores are scaled so a 3 corresponds to roughly the 50th percentile |
Standard deviation units are especially useful in identifying outliers. Values beyond ±3 units are rare in normal distributions-occurring less than 0.3% of the time. In a dataset of 1,000 observations, fewer than four would be expected beyond ±3σ.
Many assume standard deviation units reflect percentage change or proportion. That's incorrect. A value at +1 unit doesn't mean "100% better"-it means one standard deviation above the mean. The unit is dimensionless in the sense that it measures distance in standard deviations, not percentages.
Another error is treating all distributions as normal. The empirical rule applies strictly to normal (Gaussian) distributions. In skewed or heavy-tailed data, such as income or housing prices, ±1σ may cover only 50-60% of values. Using standard deviation units without checking distribution shape leads to misinterpretation.
A non-obvious fact: standard deviation units are invariant under linear transformations. If you convert temperatures from Celsius to Fahrenheit, the standard deviation changes-but the number of standard deviation units remains the same. This property makes them ideal for comparing effect sizes across measurement systems.
Consider a company tracking daily website visits over 30 days. The mean is 1,200 visits, and the standard deviation is 150. A day with 1,500 visits is (1,500 − 1,200) ÷ 150 = +2 standard deviation units above average.
Using the empirical rule, we expect such a spike to occur only about 2.5% of the time if the data is normally distributed. But if the company sees this level of traffic five times in 30 days, it suggests the distribution is not normal-possibly due to marketing campaigns or seasonal effects. This signals the need to investigate underlying causes rather than treat each spike as random.
I observed this pattern while analyzing web traffic for a small e-commerce site. Initially, we assumed spikes were noise. After converting to standard deviation units, we noticed that high-traffic days consistently fell between +2 and +3 units. That led us to correlate traffic with email campaign launches-confirming a causal relationship.
Standard deviation units differ from percentiles. A value at +1 standard deviation unit is not at the 84th percentile unless the distribution is normal. In skewed data, the same unit value could correspond to a much lower percentile.
They also differ from standard error, which measures uncertainty in sample means-not individual data spread. Standard error decreases with larger samples; standard deviation units stay constant unless the underlying data changes.
When interpreting data, always verify whether the distribution is approximately normal before applying standard deviation unit rules. In non-normal cases, consider using interquartile range or median absolute deviation instead.
Standard deviation units remain a foundational tool for quantifying variation. Their use ensures consistent, interpretable comparisons across diverse datasets and disciplines.