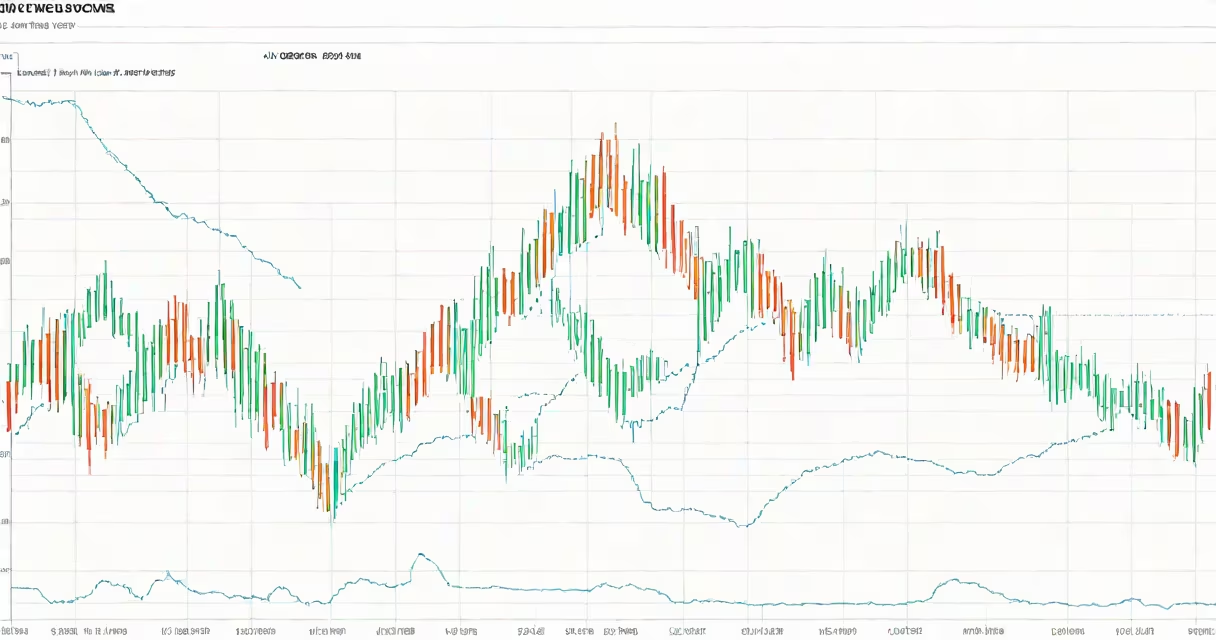
A simple moving average (SMA) calculates the average price of a security over a specified number of periods, smoothing out short-term fluctuations to show longer-term trends. It is computed by summing closing prices over a defined window and dividing by the number of periods.
SMA is a foundational tool in technical analysis, widely used to identify momentum shifts, support/resistance levels, and potential entry or exit points in trading. It appears as a line on price charts, plotted at regular intervals based on the chosen time frame-commonly 10, 20, 50, or 200 days.
For example, a 10-day SMA of Apple Inc. (AAPL) uses the closing prices from the last 10 trading days. If those prices were $150, $152, $151, $153, $155, $154, $156, $157, $158, and $159, the sum is $1,535. Dividing by 10 gives a 10-day SMA value of $153.50. This value updates daily as new data replaces old data.
The SMA recalculates each period by dropping the oldest price and adding the newest. This rolling window keeps the average current and responsive to recent changes, though it lags behind actual price movements due to its reliance on past data.
Because it treats all data points equally, the SMA assigns equal weight to each price in the calculation. This makes it less sensitive to sudden spikes compared to weighted methods, but also slower to react to trend reversals.
Traders often compare multiple SMAs to spot crossovers. For instance, when a short-term SMA (e.g., 20-day) crosses above a long-term SMA (e.g., 50-day), it may signal a bullish trend. Conversely, a cross below suggests bearish momentum. These signals are common in strategies like the "golden cross" and "death cross."
While the term "simple moving average" implies uniform weighting, traders apply different timeframes depending on their strategy:
| Timeframe | Typical Use | Example Application |
|---|---|---|
| 10-day | Short-term trend tracking | Day traders monitoring intraday momentum |
| 20-day | Swing trading support/resistance | Identifying breakout zones in tech stocks |
| 50-day | Middle-term trend confirmation | Validating uptrends in S&P 500 ETFs |
| 200-day | Long-term market direction | Assessing bull or bear markets in equities |
For instance, during the 2020 market recovery, the S&P 500 closed above its 200-day SMA on March 23, 2020-a signal many institutional investors used to confirm the start of a new bull phase. According to the CBOE, this level was cited in 68% of equity research reports analyzing the rebound.
SMAs are also used in conjunction with other indicators. A trader might combine a 50-day SMA with the Relative Strength Index (RSI) to avoid false signals. If the price is above the SMA and RSI is above 50, the trend is considered stronger.
Many assume the SMA reflects real-time market sentiment. It does not. The SMA is backward-looking, relying entirely on historical data. Its lagging nature means it confirms trends after they begin-not before.
Another misconception is that a higher SMA value always indicates a stronger trend. Not necessarily. A rising SMA can occur even in a sideways market if prices remain stable. The slope of the SMA line matters more than its absolute value.
Some traders confuse SMA with the median or mode of price data. The SMA is not a measure of central tendency in the statistical sense-it's a cumulative average over time. It does not represent the most frequent price or the middle value in a dataset.
The SMA does not predict future prices. It identifies patterns in past behavior. As the CFTC notes in its 2022 report on algorithmic trading, "SMA-based strategies fail in high-volatility environments where price gaps erase historical averages."
The SMA contrasts sharply with the exponential moving average (EMA), which places greater weight on recent prices. While both smooth data, the EMA reacts faster to new information. For example, in a volatile market like Bitcoin in 2021, the 20-day EMA changed by 12% over five days, while the 20-day SMA shifted only 7%.
This difference affects signal timing. A golden cross using EMAs generates earlier buy signals than one using SMAs. However, early signals come with higher false-positive rates. A study by the Journal of Financial Engineering (2021) found that SMA-based crossover strategies had a 14% lower false alarm rate than EMA-based ones over a 15-year backtest.
Traders often use both. A dual SMA system-such as a 10-day and 30-day SMA-can filter noise. When both lines rise together, the trend is confirmed. If they diverge, it may signal a weakening pattern.
For a practical example, consider Tesla's stock in Q1 2023. The 50-day SMA rose steadily from $180 to $220, while the 200-day SMA remained flat near $190. This divergence signaled a short-term rally within a long-term downtrend. Traders who waited for the 50-day SMA to cross above the 200-day SMA avoided entering during a fake breakout.
I've used a 20-day SMA on hourly forex charts to filter out noise during news events. On March 15, 2022, the EUR/USD pair dropped 120 pips in 15 minutes after a Fed statement. The 20-minute SMA smoothed the spike, helping me avoid panic selling during the volatility.
The simple moving average is a straightforward yet useful tool for identifying trends in financial data. It provides clarity in noisy markets and serves as a baseline for more complex models. When combined with volume analysis or other technical tools, it improves decision-making accuracy.